OpenTelemetry Integration
OpenTelemetry over OTLP/HTTP is how you send data to TracePath. Go, Node.js, Python, PHP, Java, .NET, Ruby: whatever your server runs on, it exports traces, metrics, and logs to the same ingest endpoint. There is no TracePath SDK to install, no vendor wrapper to learn per framework, and no separate TracePath project per backend service.
OpenTelemetry (opens in a new tab) (OTel) is the industry-standard, vendor-neutral framework for collecting telemetry. If your app already uses OTel, you can point it at TracePath by changing two settings: the endpoint and one header. If you are starting fresh, any OTel SDK will work.
Three things you need before any snippet on this page runs:
- An account. Sign up at app.tracepath.dev/register (opens in a new tab).
- A project. Create one with framework OpenTelemetry. Send your API, background workers, scheduled jobs, AI calls, and host metrics to that one project — see Project Structure.
- Its project token. Copy it from the project's Connection page in the dashboard. It is the only credential the ingest endpoint accepts.
How It Works
- Instrument your app with an OpenTelemetry SDK (or auto-instrumentation).
- Export via OTLP/HTTP to
https://ingest.tracepath.dev/api/otel, withAuthorization: Bearer <project_token>. Your SDK, or an OTel Collector in front of it, does the sending. - TracePath maps the data: spans become endpoints and traces, metrics appear on your dashboards, and logs are indexed and linked to their originating traces.
Three signals, three exporters
OTel treats traces, metrics and logs as three independent signals. Each one needs its own exporter wired into the SDK. Configuring a trace exporter does not start sending logs, and auto-instrumentation packages do not add a log exporter for you. This is the most common reason the Logs page stays empty.
| Signal | Path | What you must add | Without it |
|---|---|---|---|
| Traces | /v1/traces | a trace exporter (traceExporter / BatchSpanProcessor) | No endpoints, tasks, spans or issues |
| Metrics | /v1/metrics | a metric reader (PeriodicExportingMetricReader) | Empty dashboard widgets |
| Logs | /v1/logs | a log record processor and a bridge from your logging library | Empty Logs page |
Logs need one extra step the other two do not. The OTel log exporter only ships records emitted through the OTel logs API, so you also need a bridge from whatever you actually log with: LoggingHandler for Python's logging, an slog handler for Go, a Monolog handler for PHP, the built-in appenders for the Java agent. A plain console.log or print sends nothing.
All three signals go to the same host and use the same project token. See Logs for the per-language wiring.
Supported Languages
Any language with an OTel SDK can export to TracePath. Here are the most common ones:
| Language | OTel SDK | Install |
|---|---|---|
| Java | OpenTelemetry Java (opens in a new tab) | The 2.x Java agent JAR (opens in a new tab), no code changes (see the Spring Boot quick start below) |
| Python | OpenTelemetry Python (opens in a new tab) | pip install opentelemetry-distro opentelemetry-exporter-otlp, then opentelemetry-bootstrap -a install, then run under opentelemetry-instrument. See Python guide for FastAPI, Flask, and any WSGI/ASGI app |
| Python / Django | OpenTelemetry Python zero-code (opens in a new tab) | pip install opentelemetry-distro opentelemetry-exporter-otlp opentelemetry-instrumentation-django. See Django guide |
| C# / .NET | OpenTelemetry .NET (opens in a new tab) | dotnet add package OpenTelemetry.Exporter.OpenTelemetryProtocol (pulls in OpenTelemetry) |
| Go | OpenTelemetry Go (opens in a new tab) | go get go.opentelemetry.io/otel/sdk go.opentelemetry.io/otel/exporters/otlp/otlptrace/otlptracehttp |
| Node.js | OpenTelemetry JS (opens in a new tab) | npm install @opentelemetry/sdk-node. See Node.js guide, NestJS guide, Hono guide, Next.js guide |
| PHP / Symfony | OpenTelemetry PHP (opens in a new tab) | composer require open-telemetry/sdk open-telemetry/exporter-otlp, plus the opentelemetry PECL extension for zero-code instrumentation. See Symfony guide |
| PHP / Laravel | keepsuit/laravel-opentelemetry (opens in a new tab) | composer require keepsuit/laravel-opentelemetry. See Laravel guide |
| Cloudflare Workers | Workers OTel export (opens in a new tab) | Built-in, traces and logs only, Workers Paid. See Cloudflare guide |
Every package named above is a public OpenTelemetry package, not a TracePath one. TracePath publishes no SDK, no wrapper and no CDN script: the OTLP endpoint below is the whole integration surface, which is also why an app already exporting OTel needs no new dependency at all.
Every OTel ecosystem ships the API, the SDK and the OTLP exporter as separate packages. If you install only the SDK, you get an app that records spans and throws them away. The install commands above cover the exporter too.
Configuration
| Setting | Value |
|---|---|
| Endpoint | https://ingest.tracepath.dev/api/otel |
| Traces path | /v1/traces |
| Metrics path | /v1/metrics |
| Logs path | /v1/logs |
| Auth header | Authorization: Bearer <project_token> |
| Protocol | OTLP/HTTP only, Protobuf or JSON. gRPC is not supported, so OTEL_EXPORTER_OTLP_PROTOCOL=http/protobuf is required |
| Compression | Gzip supported (Content-Encoding: gzip) |
| Content-Type | application/x-protobuf (or application/protobuf) for OTLP/Protobuf. Anything else, including a missing header, is parsed as OTLP/JSON. The response comes back in the same encoding you sent |
| Max body size | 10 MB, applied to the raw body and to the decompressed output. Gzip does not raise it. A larger export is rejected with 413 |
| Auth failure | 401 with an empty body. The header value must literally start with Bearer |
https://ingest.tracepath.dev is for telemetry only. The dashboard, the management API and source-map uploads live on https://app.tracepath.dev; point your exporter at the ingest host and nothing else.
TracePath serves OTLP over HTTP only. There is no gRPC endpoint, so set your exporter's protocol to http/protobuf (or http/json) explicitly. Several SDKs default to gRPC when the variable is unset: with OTEL_TRACES_EXPORTER=otlp and no OTEL_EXPORTER_OTLP_PROTOCOL, the Python SDK resolves to gRPC, and the Java agent does the same. The failure is silent. The app runs, exits 0, prints no warning, and every export lands nowhere.
OTEL_EXPORTER_OTLP_PROTOCOL=http/protobufSet that wherever you configure the exporter. The one exception is PHP, which needs http/json instead.
An export larger than 10 MB after decompression is rejected outright with 413 Request Entity Too Large and {"error":"request body exceeds the 10MB limit"}. Nothing is truncated and nothing is partially ingested. OTLP exporters treat 4xx as permanent and drop the batch instead of retrying, so that data is lost. Keep batches comfortably under the limit by capping the exporter's batch size: maxExportBatchSize in the JS SDK, max_export_batch_size in Python, send_batch_max_size on the Collector's batch processor. The SDK default of 512 spans per export is far below the limit.
When ingest answers 503
503 is the one rejection you are meant to retry, and every OTLP exporter and the Collector already do. It has three causes, told apart by the body:
| Body | Meaning | What to do |
|---|---|---|
{"error":"ingest saturated, retry later"}, Retry-After: 2 | A short burst hit the concurrency limit. | Nothing. The exporter resends within seconds. |
{"error":"Monthly ingest quota exceeded for this plan. Upgrade or wait for the next period."}, Retry-After: 60 | The organization has used its plan's monthly ingest allowance. | Upgrade, or wait for the next calendar month. Owners were emailed at 80%. |
{"error":"This organization is suspended. Ingest is paused."}, Retry-After: 60 | The organization is suspended — non-payment, or an acceptable-use problem. | Write to [email protected]. Retrying will not clear it. |
The first is normal backpressure and resolves itself. The other two do not: the exporter will keep retrying and backing off for as long as the pause lasts, and anything that outlives its queue is lost.
Your plan's monthly ingest allowance — 5 GB on Free, 50 GB on Pro, 250 GB on Business — is counted as decompressed bytes per organization per calendar month, across OTLP and every other ingest path. There is no overage billing, so a runaway exporter pauses ingest rather than running up a bill. See Billing and plans.
Quick Start: Direct SDK Export
The simplest setup: your app exports directly to TracePath, with no extra infrastructure.
Here is a complete Node.js setup that wires all three signals. Install the packages first:
npm install @opentelemetry/sdk-node @opentelemetry/auto-instrumentations-node \
  @opentelemetry/instrumentation @opentelemetry/api \
  @opentelemetry/exporter-trace-otlp-http @opentelemetry/exporter-metrics-otlp-http \
  @opentelemetry/exporter-logs-otlp-http @opentelemetry/sdk-metrics \
  @opentelemetry/sdk-logs @opentelemetry/resources @opentelemetry/api-logs
@opentelemetry/instrumentation is listed because the loader hook below is loaded by path from it, and @opentelemetry/api because your own code imports it. Both also arrive as transitive dependencies of the packages above, so npm's flat node_modules resolves them even when they are not declared. Declare them anyway, since your code names them directly.
Then create telemetry.mjs:
// telemetry.mjs
// Load it before your app: node --import ./telemetry.mjs server.js
import { register } from "node:module";
register("@opentelemetry/instrumentation/hook.mjs", import.meta.url);

import { NodeSDK } from "@opentelemetry/sdk-node";
import { OTLPTraceExporter } from "@opentelemetry/exporter-trace-otlp-http";
import { OTLPMetricExporter } from "@opentelemetry/exporter-metrics-otlp-http";
import { OTLPLogExporter } from "@opentelemetry/exporter-logs-otlp-http";
import { PeriodicExportingMetricReader } from "@opentelemetry/sdk-metrics";
import { BatchLogRecordProcessor } from "@opentelemetry/sdk-logs";
import { resourceFromAttributes } from "@opentelemetry/resources";
import { getNodeAutoInstrumentations } from "@opentelemetry/auto-instrumentations-node";

const BASE = "https://ingest.tracepath.dev/api/otel";
const headers = { Authorization: "Bearer your-project-token" };

const sdk = new NodeSDK({
  resource: resourceFromAttributes({
    "service.name": "my-service",
    "service.version": "1.0.0",
  }),
  traceExporter: new OTLPTraceExporter({ url: `${BASE}/v1/traces`, headers }),
  metricReaders: [
    new PeriodicExportingMetricReader({
      exporter: new OTLPMetricExporter({ url: `${BASE}/v1/metrics`, headers }),
      exportIntervalMillis: 30000,
    }),
  ],
  logRecordProcessors: [
    new BatchLogRecordProcessor({
      exporter: new OTLPLogExporter({ url: `${BASE}/v1/logs`, headers }),
    }),
  ],
  instrumentations: [getNodeAutoInstrumentations()],
});

sdk.start();
Start your app with node --import ./telemetry.mjs server.js. Loading the file first is what lets auto-instrumentation patch your HTTP server and database clients before they are imported.
Four details that break this silently if you get them wrong:
- The two
node:modulelines at the top are required for an ESM app (.mjs, or"type": "module"). Without the hook, no framework is patched,http.routeis never set, and your endpoints are named after raw span names. A CommonJS app (require,.cjs) does not need them. resourceFromAttributesreplaced the oldnew Resource(...), which was removed in@opentelemetry/resources2.x. The old form throws at import time.BatchLogRecordProcessortakes an options object, not a bare exporter.new BatchLogRecordProcessor(exporter)constructs fine and then exports nothing, with no error.metricReadersis the current option. The singularmetricReaderstill works but is deprecated.
The same pattern applies to any language: set the OTLP/HTTP endpoint and the Authorization header in your exporter config, once per signal.
End to End: One Request, Its Spans, and Its Logs
Traces and logs are separate signals with separate exporters, but they meet again in the dashboard. A log emitted inside an active span carries that span's trace_id, and the Endpoint detail page uses that id to show the request's log lines next to its waterfall.
Here is the request side, using the telemetry.mjs above. Auto-instrumentation produces spans like these for you; they are written out by hand so the correlation is visible.
import { trace, SpanKind } from "@opentelemetry/api";
import { logs, SeverityNumber } from "@opentelemetry/api-logs";

const tracer = trace.getTracer("shop");
const logger = logs.getLogger("shop");

await tracer.startActiveSpan(
  "GET /orders/:id",
  {
    kind: SpanKind.SERVER,
    attributes: { "http.request.method": "GET", "http.route": "/orders/:id" },
  },
  async (serverSpan) => {
    logger.emit({
      severityNumber: SeverityNumber.INFO,
      severityText: "INFO",
      body: "handling order lookup",
      attributes: { "order.id": "ord_123" },
    });

    await tracer.startActiveSpan(
      "SELECT orders",
      {
        kind: SpanKind.CLIENT,
        attributes: {
          "db.system": "postgresql",
          "db.query.text": "SELECT * FROM orders WHERE id = $1",
        },
      },
      async (dbSpan) => {
        // ... run the query ...
        dbSpan.end();
      },
    );

    serverSpan.setAttribute("http.response.status_code", 200);
    serverSpan.end();
  },
);
What lands in TracePath:
| What you wrote | Where it shows up |
|---|---|
The root SERVER span with http.route | Endpoints, as GET /orders/:id, with its duration and status |
| The child CLIENT span | The Spans waterfall on that endpoint's detail page, labelled with the SQL from db.query.text |
The logger.emit call | The Logs card on the same page, This Trace tab |
Anything you recordException on either span | Issues, linked back to this endpoint |
The glue is that the log record carries the root span's trace_id, and a root span's Endpoint row is keyed by that same trace id.
Note the SpanKind.SERVER on the outer span. With the default INTERNAL kind and no HTTP attributes, the span is dropped and none of this appears. See Traces for the full classification rules.
Quick Start: Spring Boot (Java Agent)
The OpenTelemetry Java agent (opens in a new tab) instruments Spring Boot applications with zero code changes. Download opentelemetry-javaagent.jar from the OpenTelemetry project's latest release (the download link is on that page), use the 2.x agent, and pass it to the JVM:
java \
  -javaagent:opentelemetry-javaagent.jar \
  -Dotel.service.name=my-spring-app \
  -Dotel.exporter.otlp.protocol=http/protobuf \
  -Dotel.exporter.otlp.endpoint=https://ingest.tracepath.dev/api/otel \
  -Dotel.exporter.otlp.headers="Authorization=Bearer <project_token>" \
  -jar target/my-app.jar
-Dotel.exporter.otlp.endpoint takes the base URL. The agent appends /v1/traces, /v1/metrics and /v1/logs itself, which is exactly how TracePath's ingest paths are laid out. (The per-signal settings such as otel.exporter.otlp.traces.endpoint are used as-is, so those need the full path.) -Dotel.service.name becomes the Server Name on every endpoint, task and issue.
Set -Dotel.exporter.otlp.protocol=http/protobuf explicitly even though it is the default on the 2.x agent. TracePath speaks OTLP/HTTP only. A 1.x agent JAR, or any environment that already exports OTEL_EXPORTER_OTLP_PROTOCOL=grpc, will send telemetry to a port that does not exist, and nothing in the dashboard will tell you.
All three signals are exported by this command. otel.traces.exporter, otel.metrics.exporter and otel.logs.exporter all default to otlp, so JVM and HTTP server metrics land on your dashboards and your Logback or Log4j output lands in Logs, with no extra flags and no appender to register. If you deliberately want traces only, add -Dotel.metrics.exporter=none -Dotel.logs.exporter=none.
Leave otel.exporter.otlp.metrics.default.histogram.aggregation at its default EXPLICIT_BUCKET_HISTOGRAM. TracePath reads explicit-bucket histograms and exposes each one as <name>.avg and <name>.count. Base-2 exponential histograms are not read and are dropped without an error, so http.server.request.duration and the JVM latency histograms would silently disappear from your dashboards.
In a container or a Kubernetes manifest, use the environment-variable form instead. Same settings, uppercased, with . and - replaced by _:
JAVA_TOOL_OPTIONS=-javaagent:/app/opentelemetry-javaagent.jar
OTEL_SERVICE_NAME=my-spring-app
OTEL_EXPORTER_OTLP_PROTOCOL=http/protobuf
OTEL_EXPORTER_OTLP_ENDPOINT=https://ingest.tracepath.dev/api/otel
OTEL_EXPORTER_OTLP_HEADERS=Authorization=Bearer <project_token>
Do not quote the OTEL_EXPORTER_OTLP_HEADERS value in a Kubernetes manifest. The quotes become part of the header value and the request comes back 401.
What lands where, with the command above:
| Spring Boot | TracePath |
|---|---|
Controller requests (@GetMapping("/orders/{id}")) | Endpoints, named GET /orders/{id}, because the Spring Web MVC instrumentation sets http.route |
@Scheduled jobs, @Async work, queue consumers | Tasks |
| JDBC, HTTP client and Redis calls inside a request | Child spans on the trace detail page |
| Uncaught controller exceptions | Issues, with the full JVM stack trace |
| Logback / Log4j output | Logs, correlated to the trace that produced it |
JVM and HTTP server metrics (jvm.memory.used, http.server.request.duration) | Metrics and dashboard widgets. Histograms appear as <name>.avg and <name>.count |
Exceptions that reach the servlet container are recorded as span events and show up in Issues. TracePath groups them by the exception class plus the normalized frame list. The message is stripped and Java, Kotlin and Scala line numbers are removed, so one failure keeps a single issue across redeploys and across differing error messages. A different call site, or a frame added or removed in the same path, is a different issue by design.
Two caveats worth knowing. The message is stripped only from the first line of the header, and only when the exception class name contains no $. Exceptions from nested classes, and exceptions whose message spans several lines, can therefore split into one issue per distinct message.
Quick Start: OTel Collector
If you already run an OpenTelemetry Collector (opens in a new tab) or want a central pipeline that fans out to multiple backends, you can route data through it. This is optional. The direct SDK export above works without a Collector.
receivers:
  otlp:
    protocols:
      grpc:
        endpoint: 0.0.0.0:4317
      http:
        endpoint: 0.0.0.0:4318

processors:
  batch:

exporters:
  otlphttp:
    endpoint: "https://ingest.tracepath.dev/api/otel"
    headers:
      Authorization: "Bearer your-project-token"

service:
  pipelines:
    traces:
      receivers: [otlp]
      processors: [batch]
      exporters: [otlphttp]
    metrics:
      receivers: [otlp]
      processors: [batch]
      exporters: [otlphttp]
    logs:
      receivers: [otlp]
      processors: [batch]
      exporters: [otlphttp]
Every pipeline must declare at least one receiver. A pipeline with only an exporters: line fails validation with must have at least one receiver and the Collector never starts.
The otlphttp exporter appends /v1/traces, /v1/metrics and /v1/logs to the base endpoint, so point it at /api/otel and nothing else.
Your apps then send to the Collector on localhost:4318 (OTLP/HTTP) or localhost:4317 (OTLP/gRPC), and the Collector is the only thing that needs your TracePath token.
Nothing Is Showing Up
TracePath accepts telemetry it cannot use rather than rejecting the whole batch, so a misconfiguration usually looks like silence rather than an error. Work down this list.
Check the wire first. Post an empty span batch and watch the status code:
curl -i -X POST https://ingest.tracepath.dev/api/otel/v1/traces \
  -H 'Content-Type: application/json' \
  -H 'Authorization: Bearer <project_token>' \
-d '{"resourceSpans":[]}'200with the body{}means the endpoint and token are good. The problem is in your SDK, or in how your spans are shaped.401with an empty body means a bad token, or a header that does not start withBearer. Check you copied the project token from the Connection page and not a personal access token.503means a saturation burst, a used-up monthly allowance or a suspended organization — the body tells you which. See When ingest answers 503.413means the batch exceeded 10 MB after decompression. Nothing was ingested. Lower the exporter's batch size.404means the path is wrong. The three full paths are/api/otel/v1/traces,/api/otel/v1/metricsand/api/otel/v1/logs— there is no version segment beforeotel, so/api/v1/tracesand/otel/v1/tracesboth 404.- Anything that is not JSON means you are talking to the wrong host. OTLP goes to
ingest.tracepath.dev;app.tracepath.devserves the dashboard and will answer with HTML.
Then check the shape.
| Symptom | Cause | Fix |
|---|---|---|
| Background job or cron never appears on Tasks | Its root span uses the default SpanKind.INTERNAL, so it is discarded | Set kind: SpanKind.CONSUMER, or add a console.command attribute for CLI commands |
| Endpoint is named after the span, not the route | No http.request.method or http.method on the span. Without a method the route is ignored entirely | Set the method attribute alongside http.route |
| One endpoint row per URL, thousands of them | Only url.path is set, so the concrete URL becomes the name | Set http.route to the low-cardinality template, /users/:id |
Requests appear as UNMATCHED | They are 404s with no matched route, collapsed on purpose | Expected. A matched route returning 404 keeps its name |
| The same route is listed twice with a Mixed chip | A batch processor split the parent and child spans across two exports, so the child was promoted to its own endpoint | Raise maxExportBatchSize / scheduledDelayMillis, or stop emitting the redundant sub-handler span |
| Nothing at all from an ESM Node app | The @opentelemetry/instrumentation/hook.mjs loader hook is missing, so nothing was patched | Add the two node:module lines shown above |
| Logs page is empty | No log exporter is wired (a trace exporter does not send logs), or there is no bridge from your logging library into the OTel logs API | See Logs |
| Logs exist but the endpoint's Logs card is empty | The endpoint was promoted from a non-root span, so it is keyed by span id and not by the trace id the logs carry | Search the trace id on the Logs page |
| A whole metric family is missing | It is an ExponentialHistogram or a Summary. Both are dropped without an error | Switch to explicit-bucket histograms, or convert in the Collector |
| Metrics arrive but every series looks identical | The distinguishing attribute is on the Resource and is not in the allowlist | Emit it as a data-point attribute instead. See Metrics |
| Large exports vanish and the exporter logs a 413 | The batch exceeded 10 MB after decompression and was rejected outright | Lower the exporter's batch size |
Turn on the SDK's own diagnostics. Most silent client-side failures, including a mis-constructed exporter or processor, only surface here:
import { diag, DiagConsoleLogger, DiagLogLevel } from "@opentelemetry/api";
diag.setLogger(new DiagConsoleLogger(), DiagLogLevel.DEBUG);
The equivalents are OTEL_LOG_LEVEL=debug for Python and the Java agent, and otel.SetErrorHandler for Go.
Connection Page
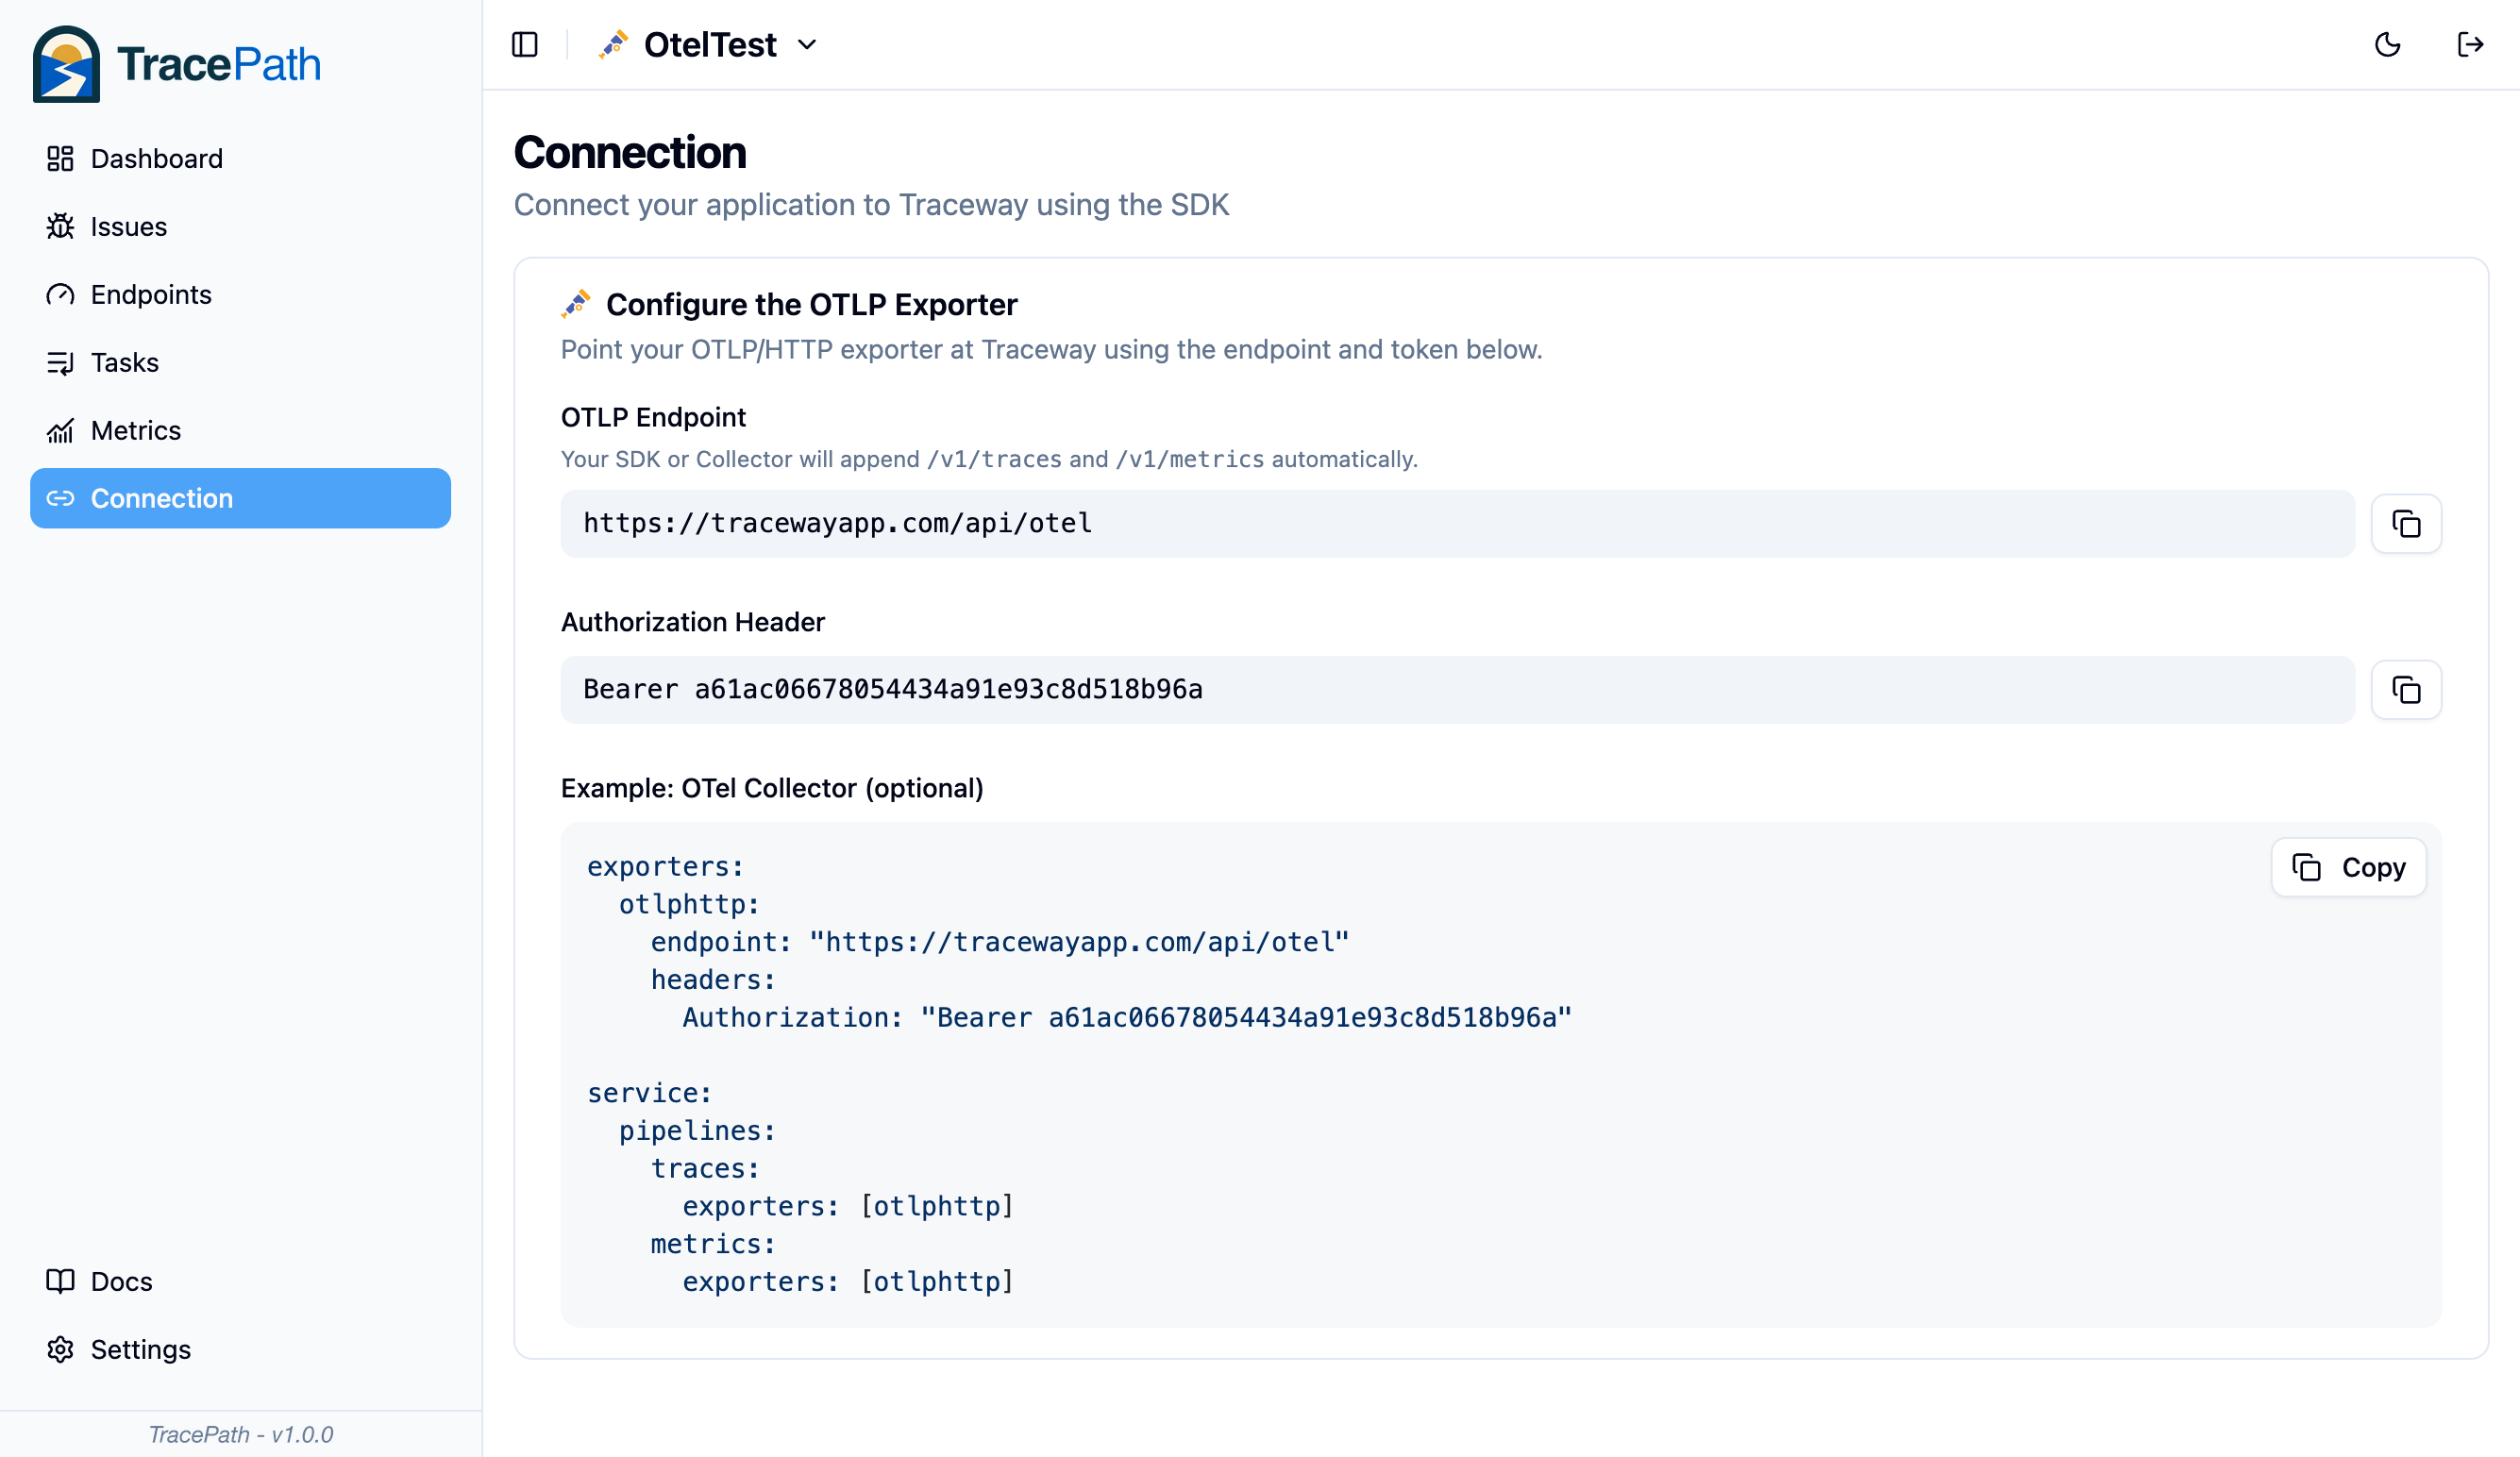
Every project in the dashboard at app.tracepath.dev (opens in a new tab) has a Connection page with a ready-made config snippet and that project's token already filled in. Open Connection in the sidebar and copy from there rather than retyping the endpoint.
Next Steps
- Traces: how OTel spans map to TracePath concepts
- Metrics: supported metric types and histogram handling
- Logs: export OTel logs and link them to your traces
Framework guides, all on this same OTLP path:
Not listed here? There is nothing framework-specific to install. Follow your language's OTel quick start, then set the endpoint and the Authorization header from the Configuration table above.
Something not working, or a question this page does not answer: [email protected].