Cloudflare Workers
Workers Paid plan only, and still in beta. Cloudflare lists OTLP export as "Not available" on the Workers Free plan. On the Free plan you can follow every step on this page, redeploy, and receive nothing. Export is free on Workers Paid for now, during the beta. Cloudflare starts billing tracing on October 1, 2026, with 10 million events per month included for traces and another 10 million for logs, then $0.05 per additional million. The Destinations tab in the Cloudflare dashboard still carries a Beta badge. Check Exporting OpenTelemetry Data (opens in a new tab) for the current terms before you rely on this in production.
Cloudflare Workers has built-in observability that exports traces and logs over OTLP. No SDK and no code changes are needed in your Worker. You create a destination in the Cloudflare dashboard, point it at TracePath, and enable it in your wrangler.jsonc.
Create the TracePath project with framework OpenTelemetry at app.tracepath.dev (opens in a new tab), then copy its project token from the project's Connection page. You need that token twice below.
Metrics are not part of this path. Cloudflare states that exporting Worker infrastructure metrics and custom metrics over OpenTelemetry is not available yet, and the destination form only offers Traces and Logs. Metric dashboards stay empty for a Workers-only project. To get metrics into the same project, run an OpenTelemetry Collector on a host you control (see OTel Agent), or send them from a backend service you instrument yourself.
Traces
Step 1: Create a traces destination in the Cloudflare dashboard
Open Workers Observability (opens in a new tab) in the Cloudflare dashboard (sidebar: Compute → Observability), select the Destinations tab, then click + Add Destination.
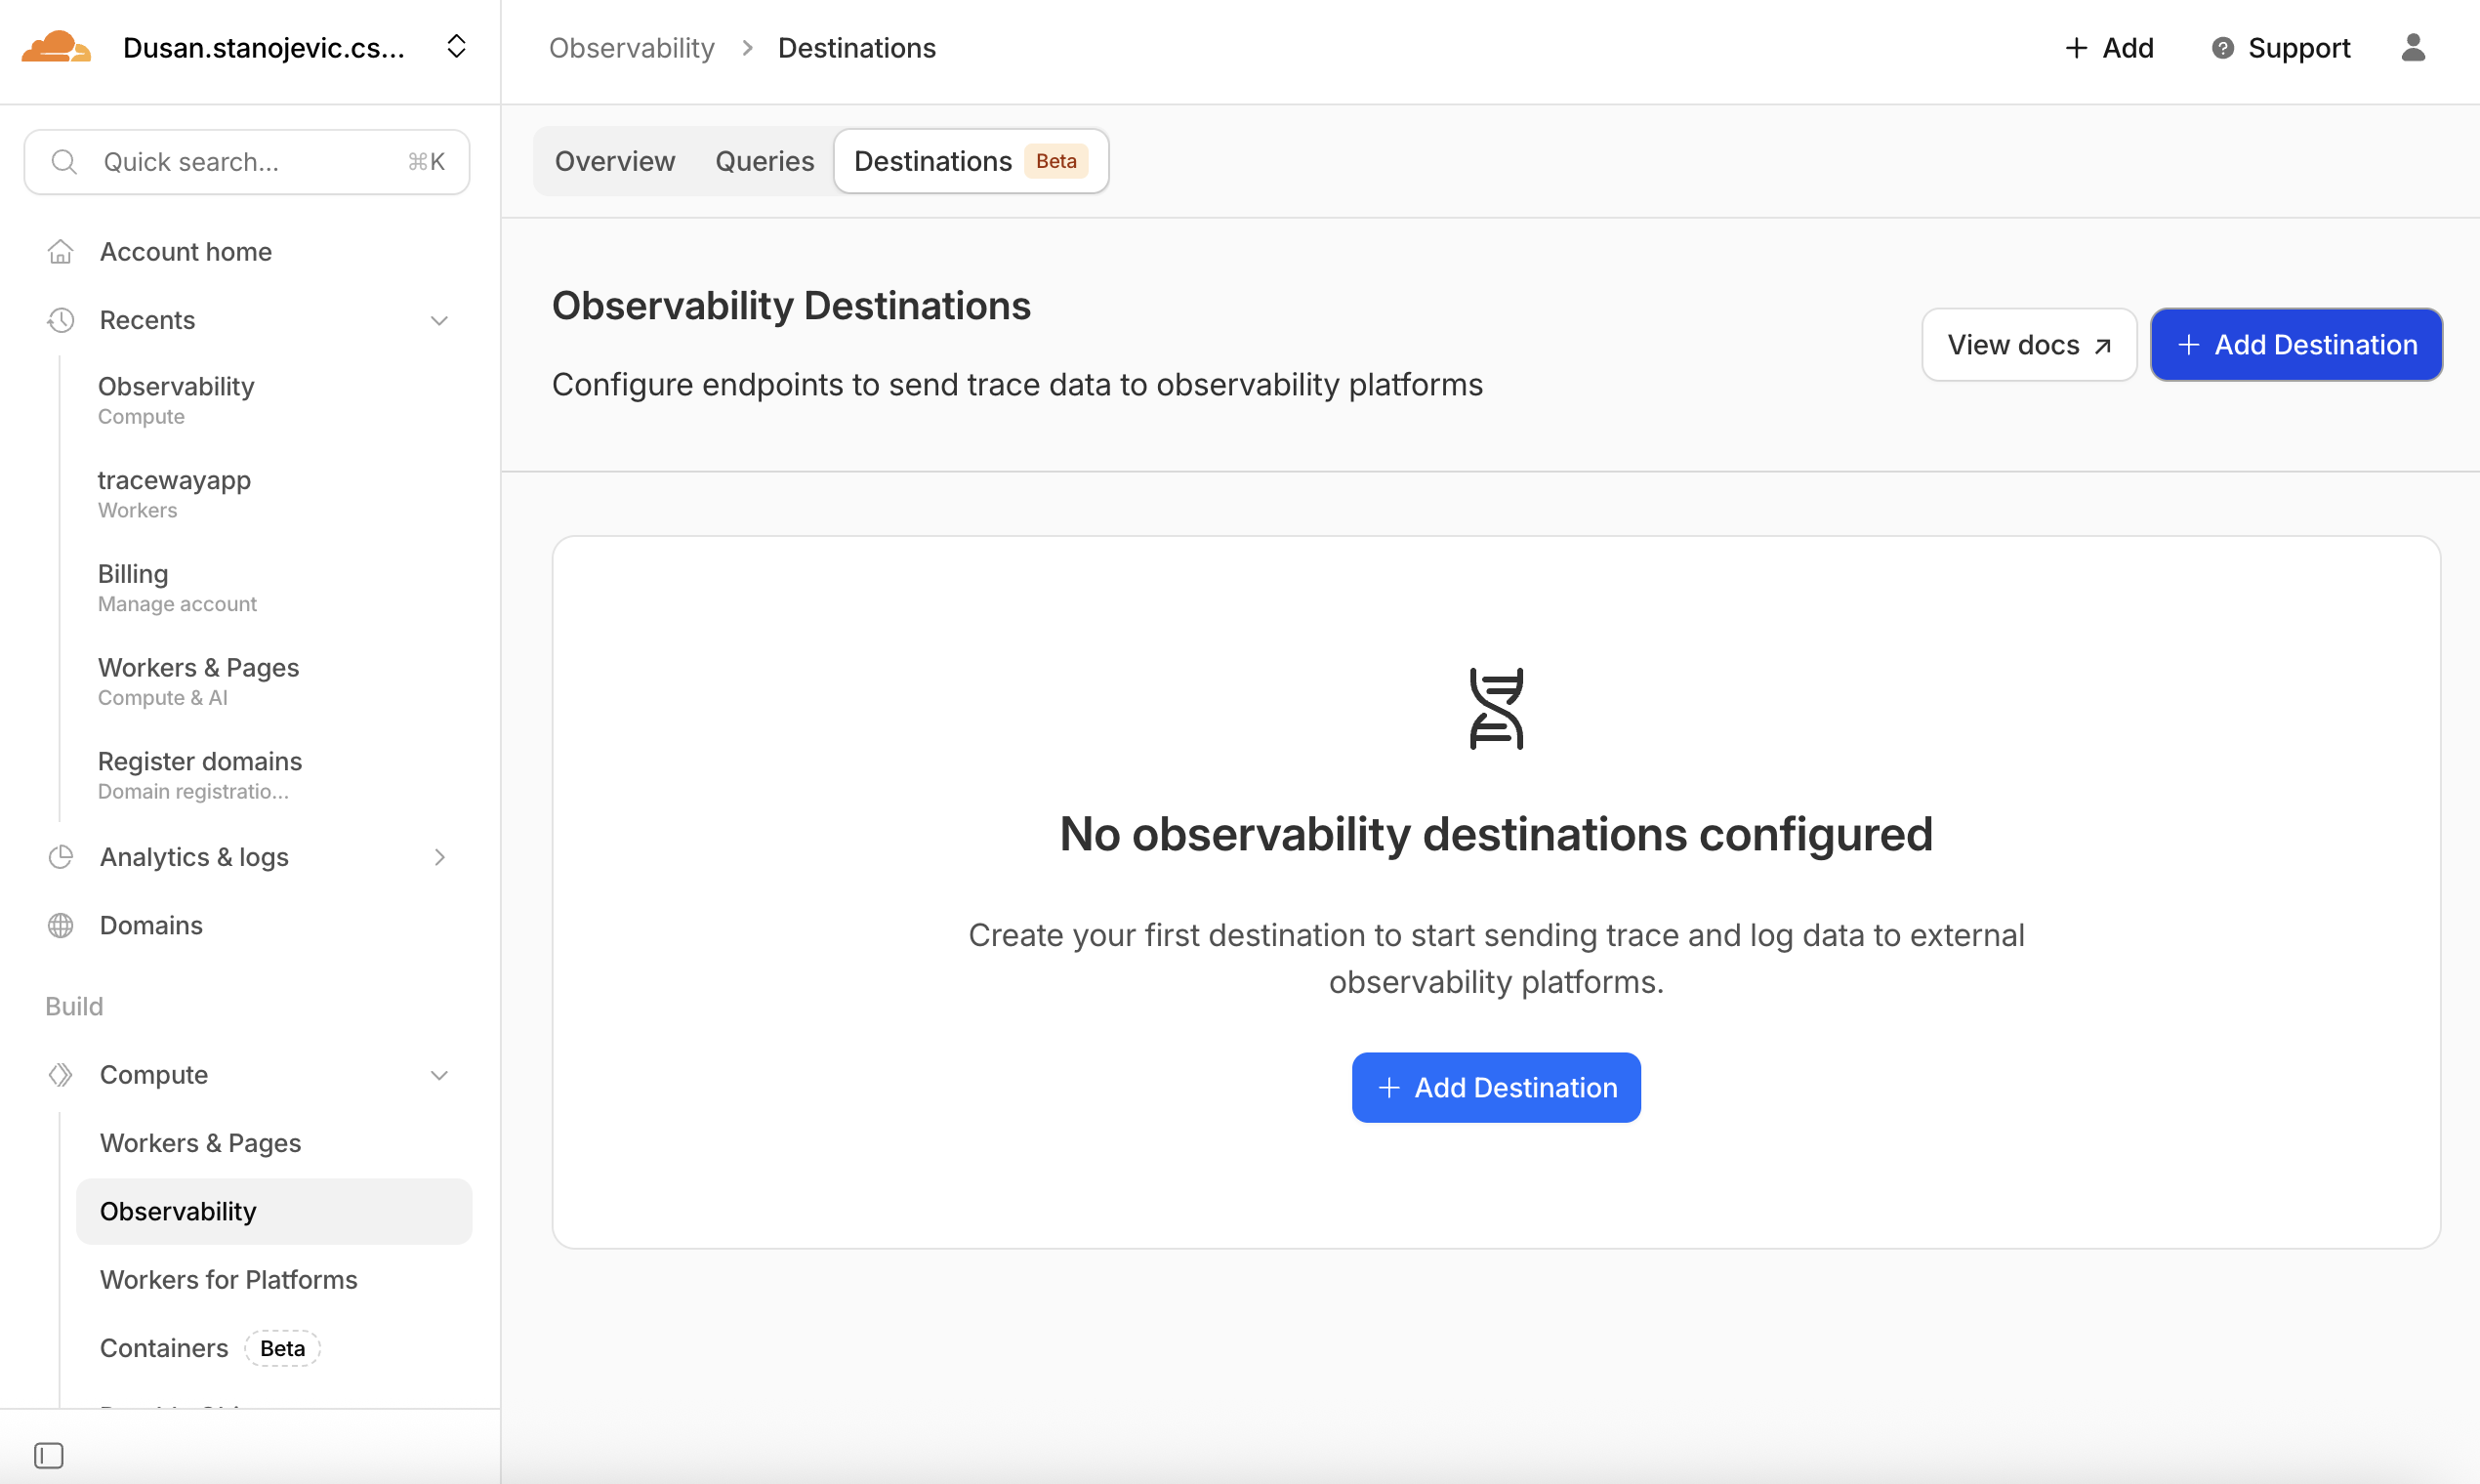
Fill in the following fields:
- Destination Type: Traces
- OTLP Traces Endpoint:
https://ingest.tracepath.dev/api/otel/v1/traces - Destination Name:
tracepath-traces - Custom Headers:
Authorization=Bearer <project_token>
Replace <project_token> with your project token from the project's Connection page. The header value is the word Bearer, a space, then the token.
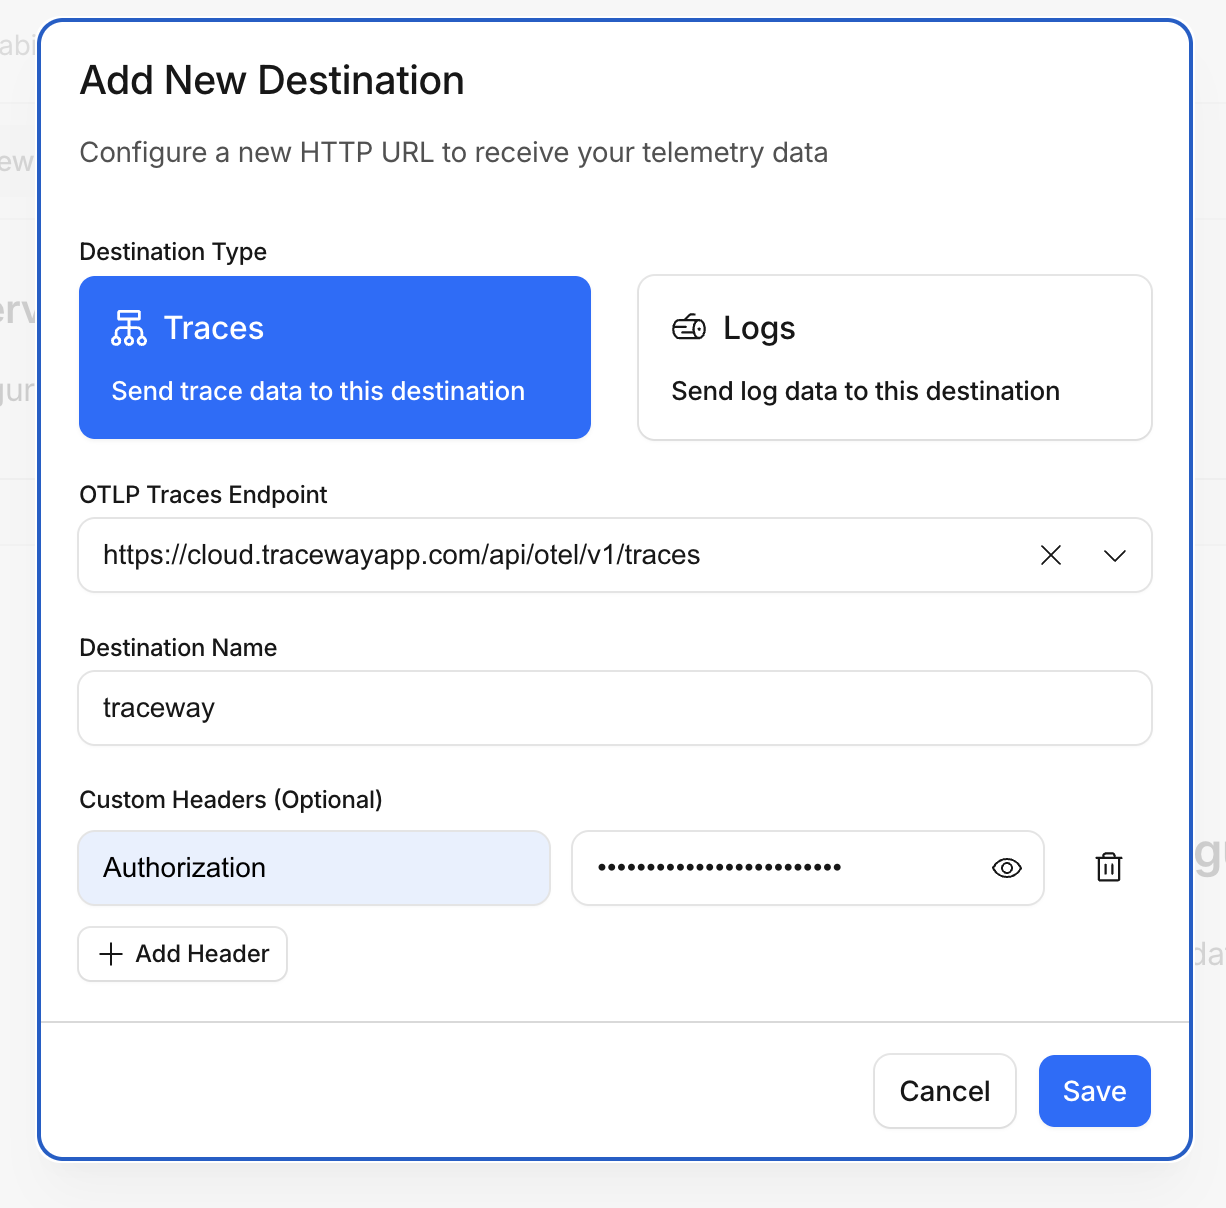
The destination name is yours to choose (the screenshot above uses tracepath). Whatever you pick has to match the wrangler.jsonc value in the next step exactly.
Step 2: Enable traces in wrangler.jsonc
Add the observability.traces configuration to your wrangler.jsonc, referencing the destination name you created above:
{
  "observability": {
    "traces": {
      "enabled": true,
      "destinations": ["tracepath-traces"],
      "head_sampling_rate": 1,
      "persist": false
    }
  }
}head_sampling_rateis a number between0and1and controls what fraction of requests are traced.1traces every request. Tracing is billed per exported event once the beta pricing ends, and Cloudflare does not say whether a request counts as one event or one per span, so lower it on a high-traffic Worker.persistdefaults totrue, which keeps a copy in the Cloudflare dashboard on top of exporting it. Set it tofalsewhen TracePath is your only destination. Keep ittrueif you still want to query the data in Cloudflare.
Endpoint names: Workers traces carry no route template
Cloudflare's automatic tracing puts url.path, url.full and http.request.method on the invocation span. It never sets http.route, because the platform does not know your router's patterns. TracePath uses http.route when it is there and falls back to url.path, so you get one endpoint row per distinct URL:
GET /orders/8f21c0
GET /orders/a934bb
GET /orders/c710de
instead of a single GET /orders/:id. For a Worker serving a handful of fixed paths that is fine. For a Worker with dynamic path segments, a Hono or itty-router app for example, the Endpoints page fills with one-hit rows, per-endpoint P50 and P95 stop meaning anything, and endpoint-scoped notification rules never match.
There is no way to set http.route from inside a Worker today. The custom span API (opens in a new tab) can only annotate spans you create yourself, not the platform's root invocation span. What you can do is name a child span after the route pattern, so the pattern is at least visible and searchable on the trace:
import { tracing } from "cloudflare:workers";

export default {
  async fetch(request: Request): Promise<Response> {
    return tracing.enterSpan("GET /orders/:id", async () => {
      const id = new URL(request.url).pathname.split("/").pop();
      return Response.json({ id });
    });
  },
};
That span shows up under the trace in TracePath, but the endpoint row still carries the raw path. If per-route aggregates matter more to you than a zero-code setup, instrument the service behind the Worker with an OTel SDK that does set http.route (see the Node.js guide) and send it to the same project.
Logs
Logs work like traces. Create a second destination in the dashboard, add a second block to wrangler.jsonc, and redeploy. No Worker code changes.
Step 1: Create a logs destination in the Cloudflare dashboard
Back on the Destinations tab, click + Add Destination a second time and fill in:
- Destination Type: Logs
- OTLP Logs Endpoint:
https://ingest.tracepath.dev/api/otel/v1/logs - Destination Name:
tracepath-logs - Custom Headers:
Authorization=Bearer <project_token>
Use the same project token as the traces destination.
Step 2: Enable logs in wrangler.jsonc
Add the observability.logs block alongside observability.traces:
{
  "observability": {
    "traces": {
      "enabled": true,
      "destinations": ["tracepath-traces"],
      "head_sampling_rate": 1,
      "persist": false
    },
    "logs": {
      "enabled": true,
      "destinations": ["tracepath-logs"],
      "head_sampling_rate": 1,
      "persist": false
    }
  }
}
head_sampling_rate and persist mean the same thing in both blocks. persist is easy to miss on the traces block: leave it out there and you keep paying for Cloudflare-side trace storage you did not ask for.
When both traces and logs are enabled, each log carries the trace_id and span_id of the request that produced it, so TracePath shows those logs on the matching trace detail page automatically. Anything you console.log in your Worker lands in Logs, with the Worker's name as the service.
See OTel Logs for the full OTLP logs mapping and severity reference.
Errors: an uncaught exception does not become an Issue on its own
When your Worker throws, Cloudflare returns an error response and records the failure. It does not attach an OTel exception to the span. The invocation span arrives with cloudflare.outcome set to exception, so you see the failed request on the Endpoints page, and the error text arrives in Logs. Nothing reaches Issues, so there is no grouped issue and no stack trace.
To get an Issue with a stack trace, catch the error yourself and put the three OTel exception attributes on a span. TracePath turns any span carrying exception.type, exception.message or exception.stacktrace into an issue, grouped by the normalized stack trace:
import { tracing } from "cloudflare:workers";

async function handle(request: Request): Promise<Response> {
  if (new URL(request.url).pathname === "/boom") {
    throw new Error("payment gateway timeout");
  }
  return new Response("ok");
}

export default {
  async fetch(request: Request): Promise<Response> {
    try {
      return await handle(request);
    } catch (err) {
      const e = err instanceof Error ? err : new Error(String(err));
      tracing.enterSpan("uncaught error", (span) => {
        span.setAttribute("exception.type", e.name);
        span.setAttribute("exception.message", e.message);
        span.setAttribute("exception.stacktrace", e.stack ?? "");
      });
      return new Response("Internal Server Error", { status: 500 });
    }
  },
};
Deploy that and request /boom. You get an HTTP 500, an endpoint row with status 500, and an Issue titled Error: payment gateway timeout with the frames from e.stack.
The frames point into your bundled Worker, not your sources. Cloudflare sets telemetry.sdk.language to javascript, so TracePath runs these traces through JavaScript symbolication once the matching source maps are uploaded to the project.
You need the bundle Cloudflare actually runs, plus its .js.map, on disk — not your unbundled src/. Wrangler writes both when you pass an output directory to the build, and the frames in the Issue name that bundle. Upload the pair with a plain multipart POST; there is no tool to install:
curl -X POST https://app.tracepath.dev/api/sourcemaps/upload \
  -H "Authorization: Bearer $TRACEPATH_SOURCEMAP_TOKEN" \
  -F "files=@dist/worker.js" \
  -F "files=@dist/worker.js.map"
The source-map token is a separate credential from the project token, generated from the Connection page in the dashboard. Only .js, .cjs, .mjs and .map files are accepted; anything else in the form is ignored, and each file must be under 50 MB. See JavaScript symbolication for how the frames are resolved.
Cron, queue, and email handlers
Cloudflare traces scheduled, queue and email invocations too, but those root spans carry no HTTP attributes. TracePath promotes a root span to an Endpoint when it has HTTP attributes and to a Task when its span kind is CONSUMER. A root span that is neither is dropped. Its child spans are still stored, but with no Endpoint or Task to hang under they have no page to appear on, so the invocation is invisible either way. Cloudflare does not document the span kind it uses for these handlers, so treat background invocations as "may not show up" rather than "will show up as a Task".
Exceptions are the exception: a span carrying the exception.* attributes still produces an Issue even when its root span was dropped. So the error handler above is worth wrapping around your scheduled and queue handlers as well.
If you need reliable task rows for background work, do the work in a service you instrument with an OTel SDK, where you can set the span kind to CONSUMER yourself.
What TracePath shows
Cloudflare stamps its own attributes on the spans it exports and TracePath maps them for you. Nothing to configure:
| Cloudflare attribute | TracePath field |
|---|---|
service.name (your Worker's name) | Server Name on endpoints, tasks and issues |
cloudflare.script_version.id | App Version, using the part after the last -, so you can filter issues to a single deployment |
telemetry.sdk.language = javascript | turns on JavaScript source-map symbolication for stack traces |
Cloudflare's known limitations (opens in a new tab) note that service.name is not on every span yet, so a span here and there can arrive with no server name. Cloudflare also warns that span and attribute names are not final during the beta, so re-check this table when the beta ends.
Cloudflare also puts cloudflare.colo, cloudflare.ray_id, cloudflare.outcome, cloudflare.cpu_time_ms, cloudflare.wall_time_ms and faas.trigger on the invocation span. Those arrive as attributes on the endpoint and are visible on the trace detail page. cloudflare.ray_id is the useful one: it lets you go from a Cloudflare support ticket straight to the matching TracePath trace.
Deploy
Observability config only takes effect on a new deployment, so deploy your Worker:
npx wrangler deployVerify
Send a few requests to your Worker, wait about a minute, then open TracePath:
- Endpoints: one row per URL path your Worker served (see the endpoint-naming note above).
- Logs: filter by your Worker's name in the Service field. Anything you
console.logshows up here. - Open an endpoint, then a single trace. The log lines from that request are attached to it, because Cloudflare stamps the trace and span ids onto the exported log records.
Nothing showing up? Work through these in order:
- Are you on a Workers Paid plan? OTLP export is unavailable on Workers Free and it fails quietly.
- Did you redeploy? The observability config only applies to a new deployment.
- Do the names match? The strings in
destinationsmust be identical to the destination names in the dashboard. - Is the header right? The custom header value is
Bearer <project_token>: the wordBearer, a space, then the token. A wrong token is rejected at the TracePath end. Cloudflare does show it: on the Destinations tab the destination's status reads Error instead of Last: n minutes ago.
Next Steps
- OpenTelemetry Overview: endpoint, authentication, limits and quota behaviour
- Traces: how OTel spans map to TracePath endpoints, tasks, and issues
- Logs: OTLP log ingestion and trace linkage