Alerts
Alerts notify you when conditions in your application require attention: errors, latency spikes, metric thresholds, or missing data. Configure channels and rules to get notified through email, Slack, webhooks, GitHub Issues, Pushover, or Telegram, or to page whoever is on call.
How Alerts Work
The alerting system has two parts:
- Channels define where notifications are delivered (email, Slack, webhook, GitHub, Pushover, Telegram, or an escalation policy)
- Rules define what conditions trigger a notification
When a rule's condition is met, TracePath sends a notification through the rule's attached channel. Each rule is linked to exactly one channel, but a channel can be used by multiple rules.
Channels
A channel represents a notification destination. TracePath supports the following channel types:
| Channel | Description | Configuration |
|---|---|---|
| Sends an email to one or more recipients | List of email addresses | |
| Slack | Posts a message to a Slack channel via incoming webhook | Webhook URL |
| Webhook | Sends an HTTP POST with a JSON payload to any URL | URL, optional headers, optional HMAC secret |
| GitHub | Creates a GitHub issue in a repository | Personal access token, repository owner/name, optional labels |
| Pushover | Sends push notifications to your mobile devices | User Key, App Token |
| Telegram | Sends a message via a Telegram bot to a user or group chat | Bot Token, Chat ID |
| Escalation policy | Opens an on-call page and runs the policy's escalation chain until somebody acknowledges, instead of sending a message | Escalation policy |
Each channel has a Test button that sends a sample notification so you can verify the configuration before attaching rules. Escalation-policy channels are the exception: their Test button opens a real page and notifies the on-call responder, so resolve the test page when you are done.
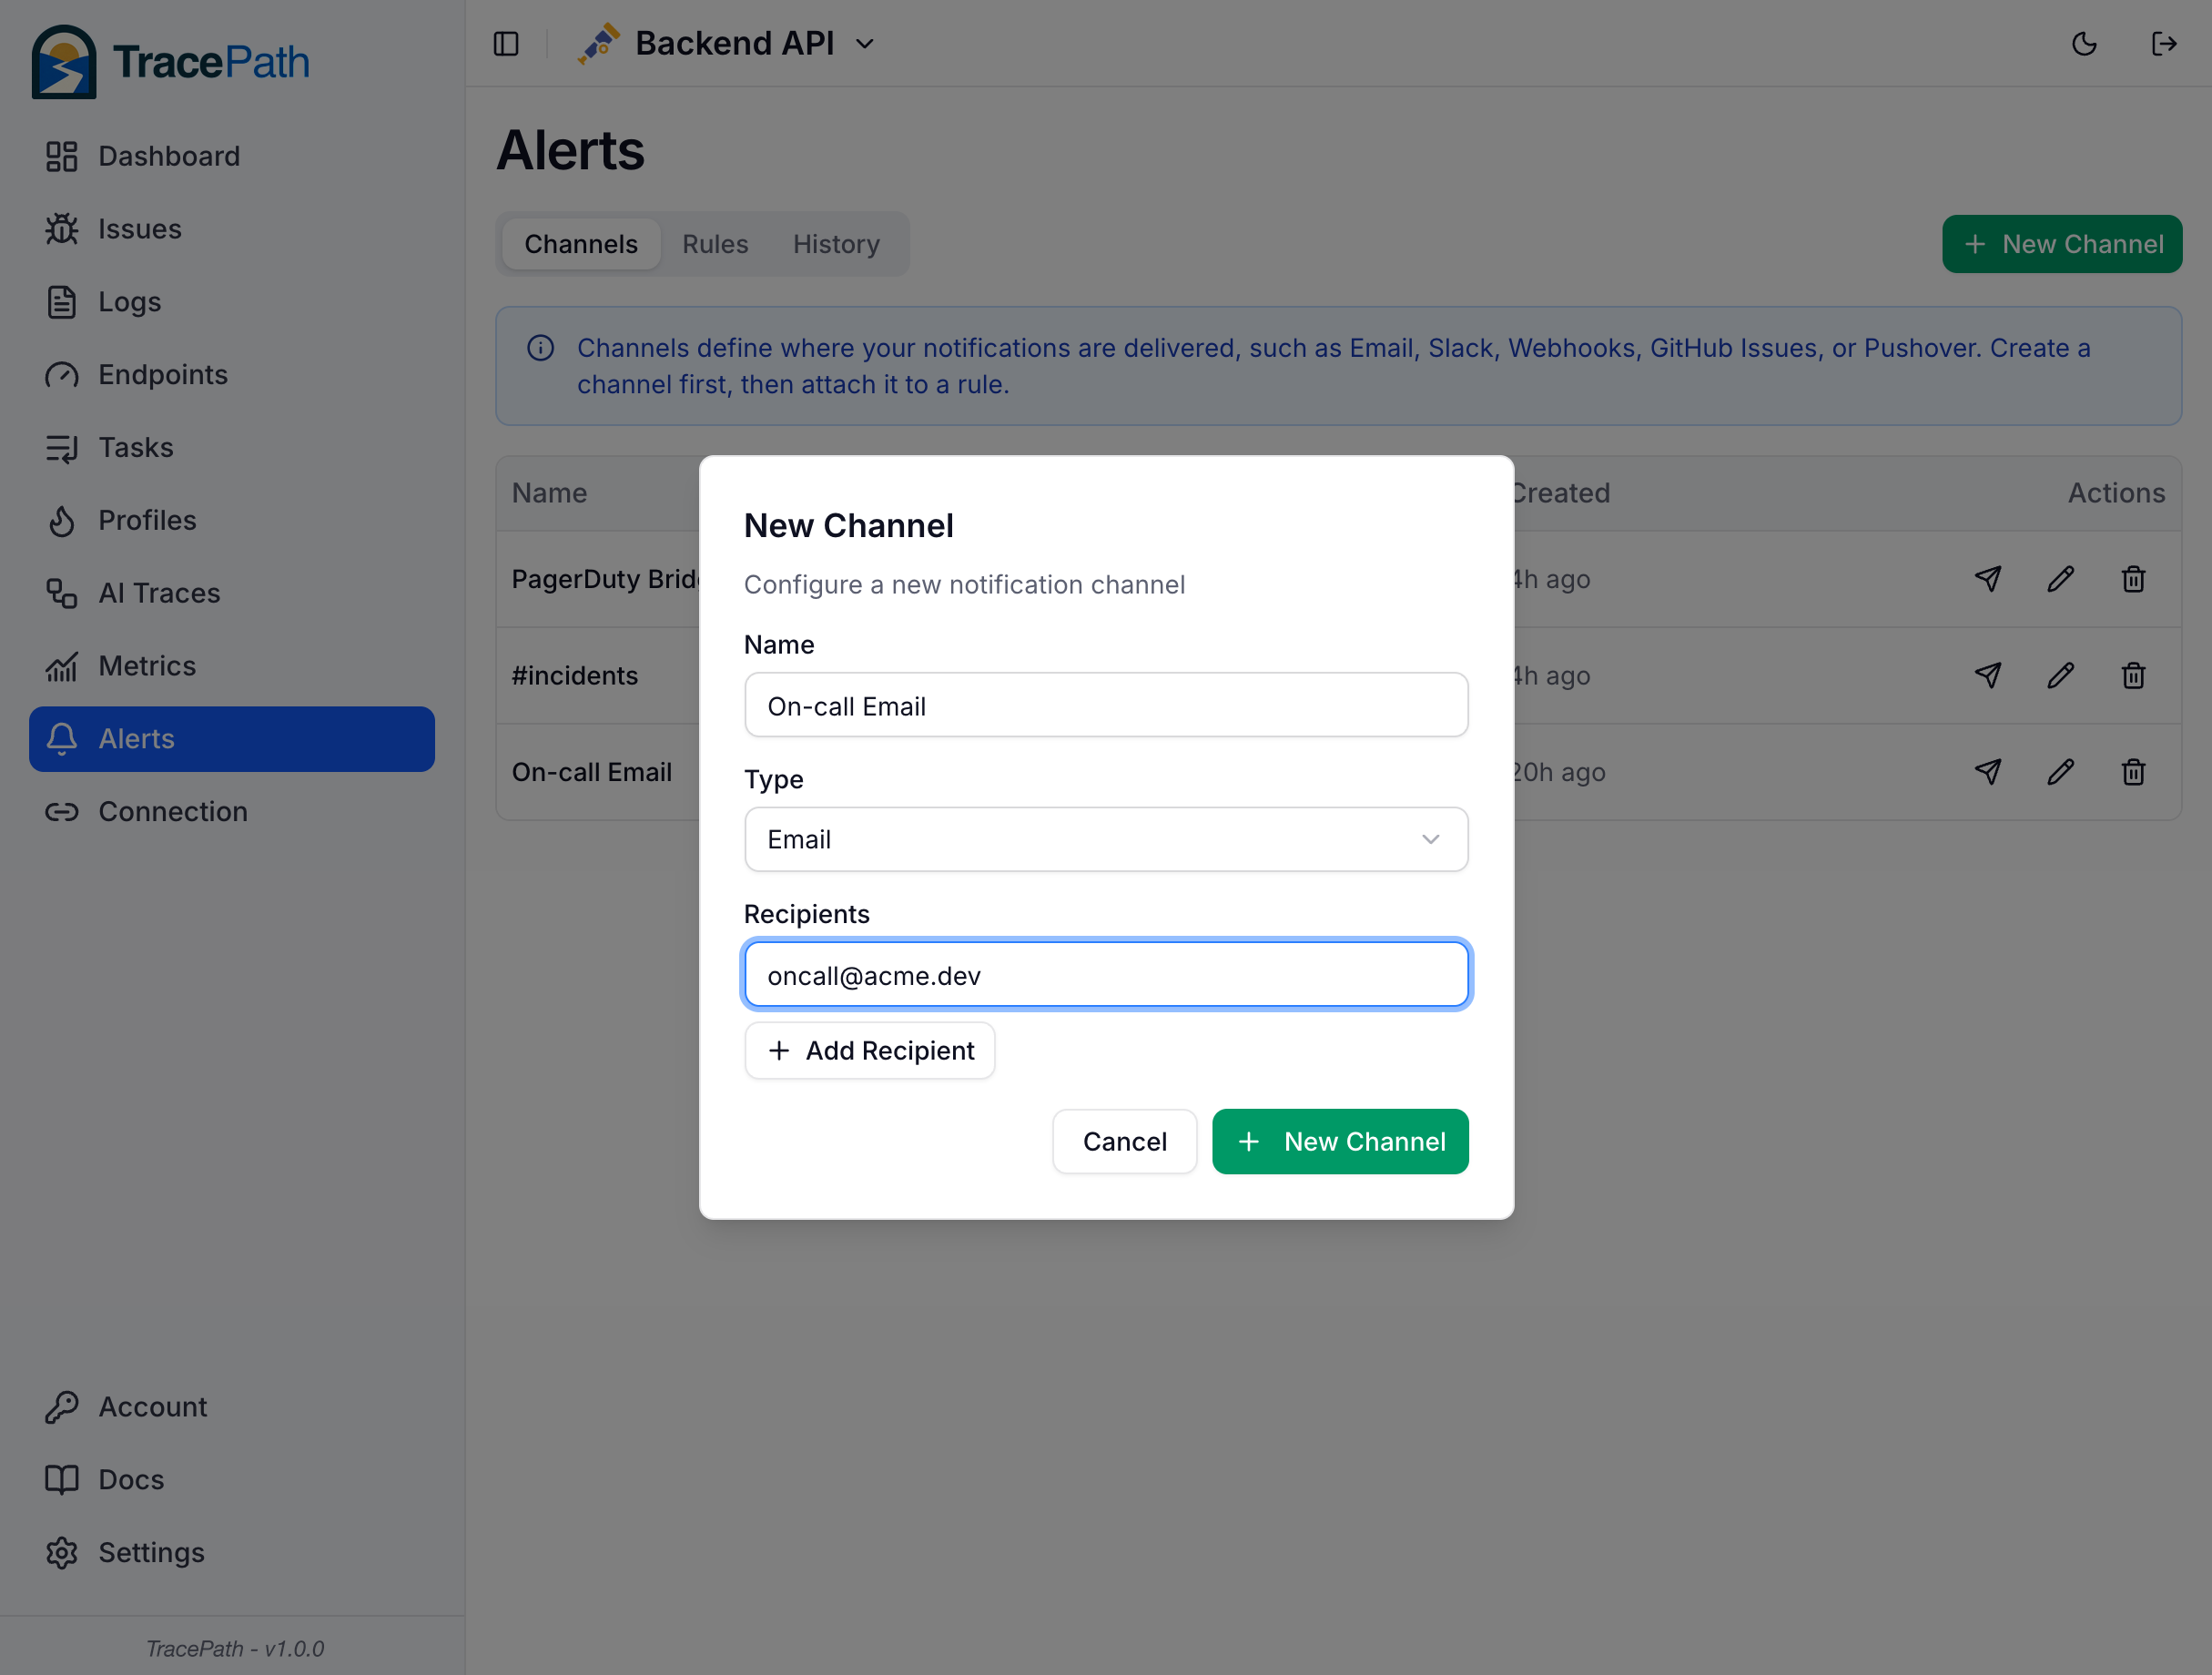
Setting Up Email
To receive alerts via email, add one or more recipient email addresses. TracePath will send an email to all listed recipients when a rule fires.
Setting Up Slack
To send alerts to a Slack channel, you need an Incoming Webhook URL:
- Go to api.slack.com/apps (opens in a new tab) and click Create New App
- Choose From scratch, give it a name (e.g. "TracePath Alerts"), and select your workspace
- In the app settings, navigate to Incoming Webhooks and toggle it on
- Click Add New Webhook to Workspace, select the channel you want alerts posted to, and click Allow
- Copy the Webhook URL. It will look like
https://hooks.slack.com/services/T.../B.../xxx
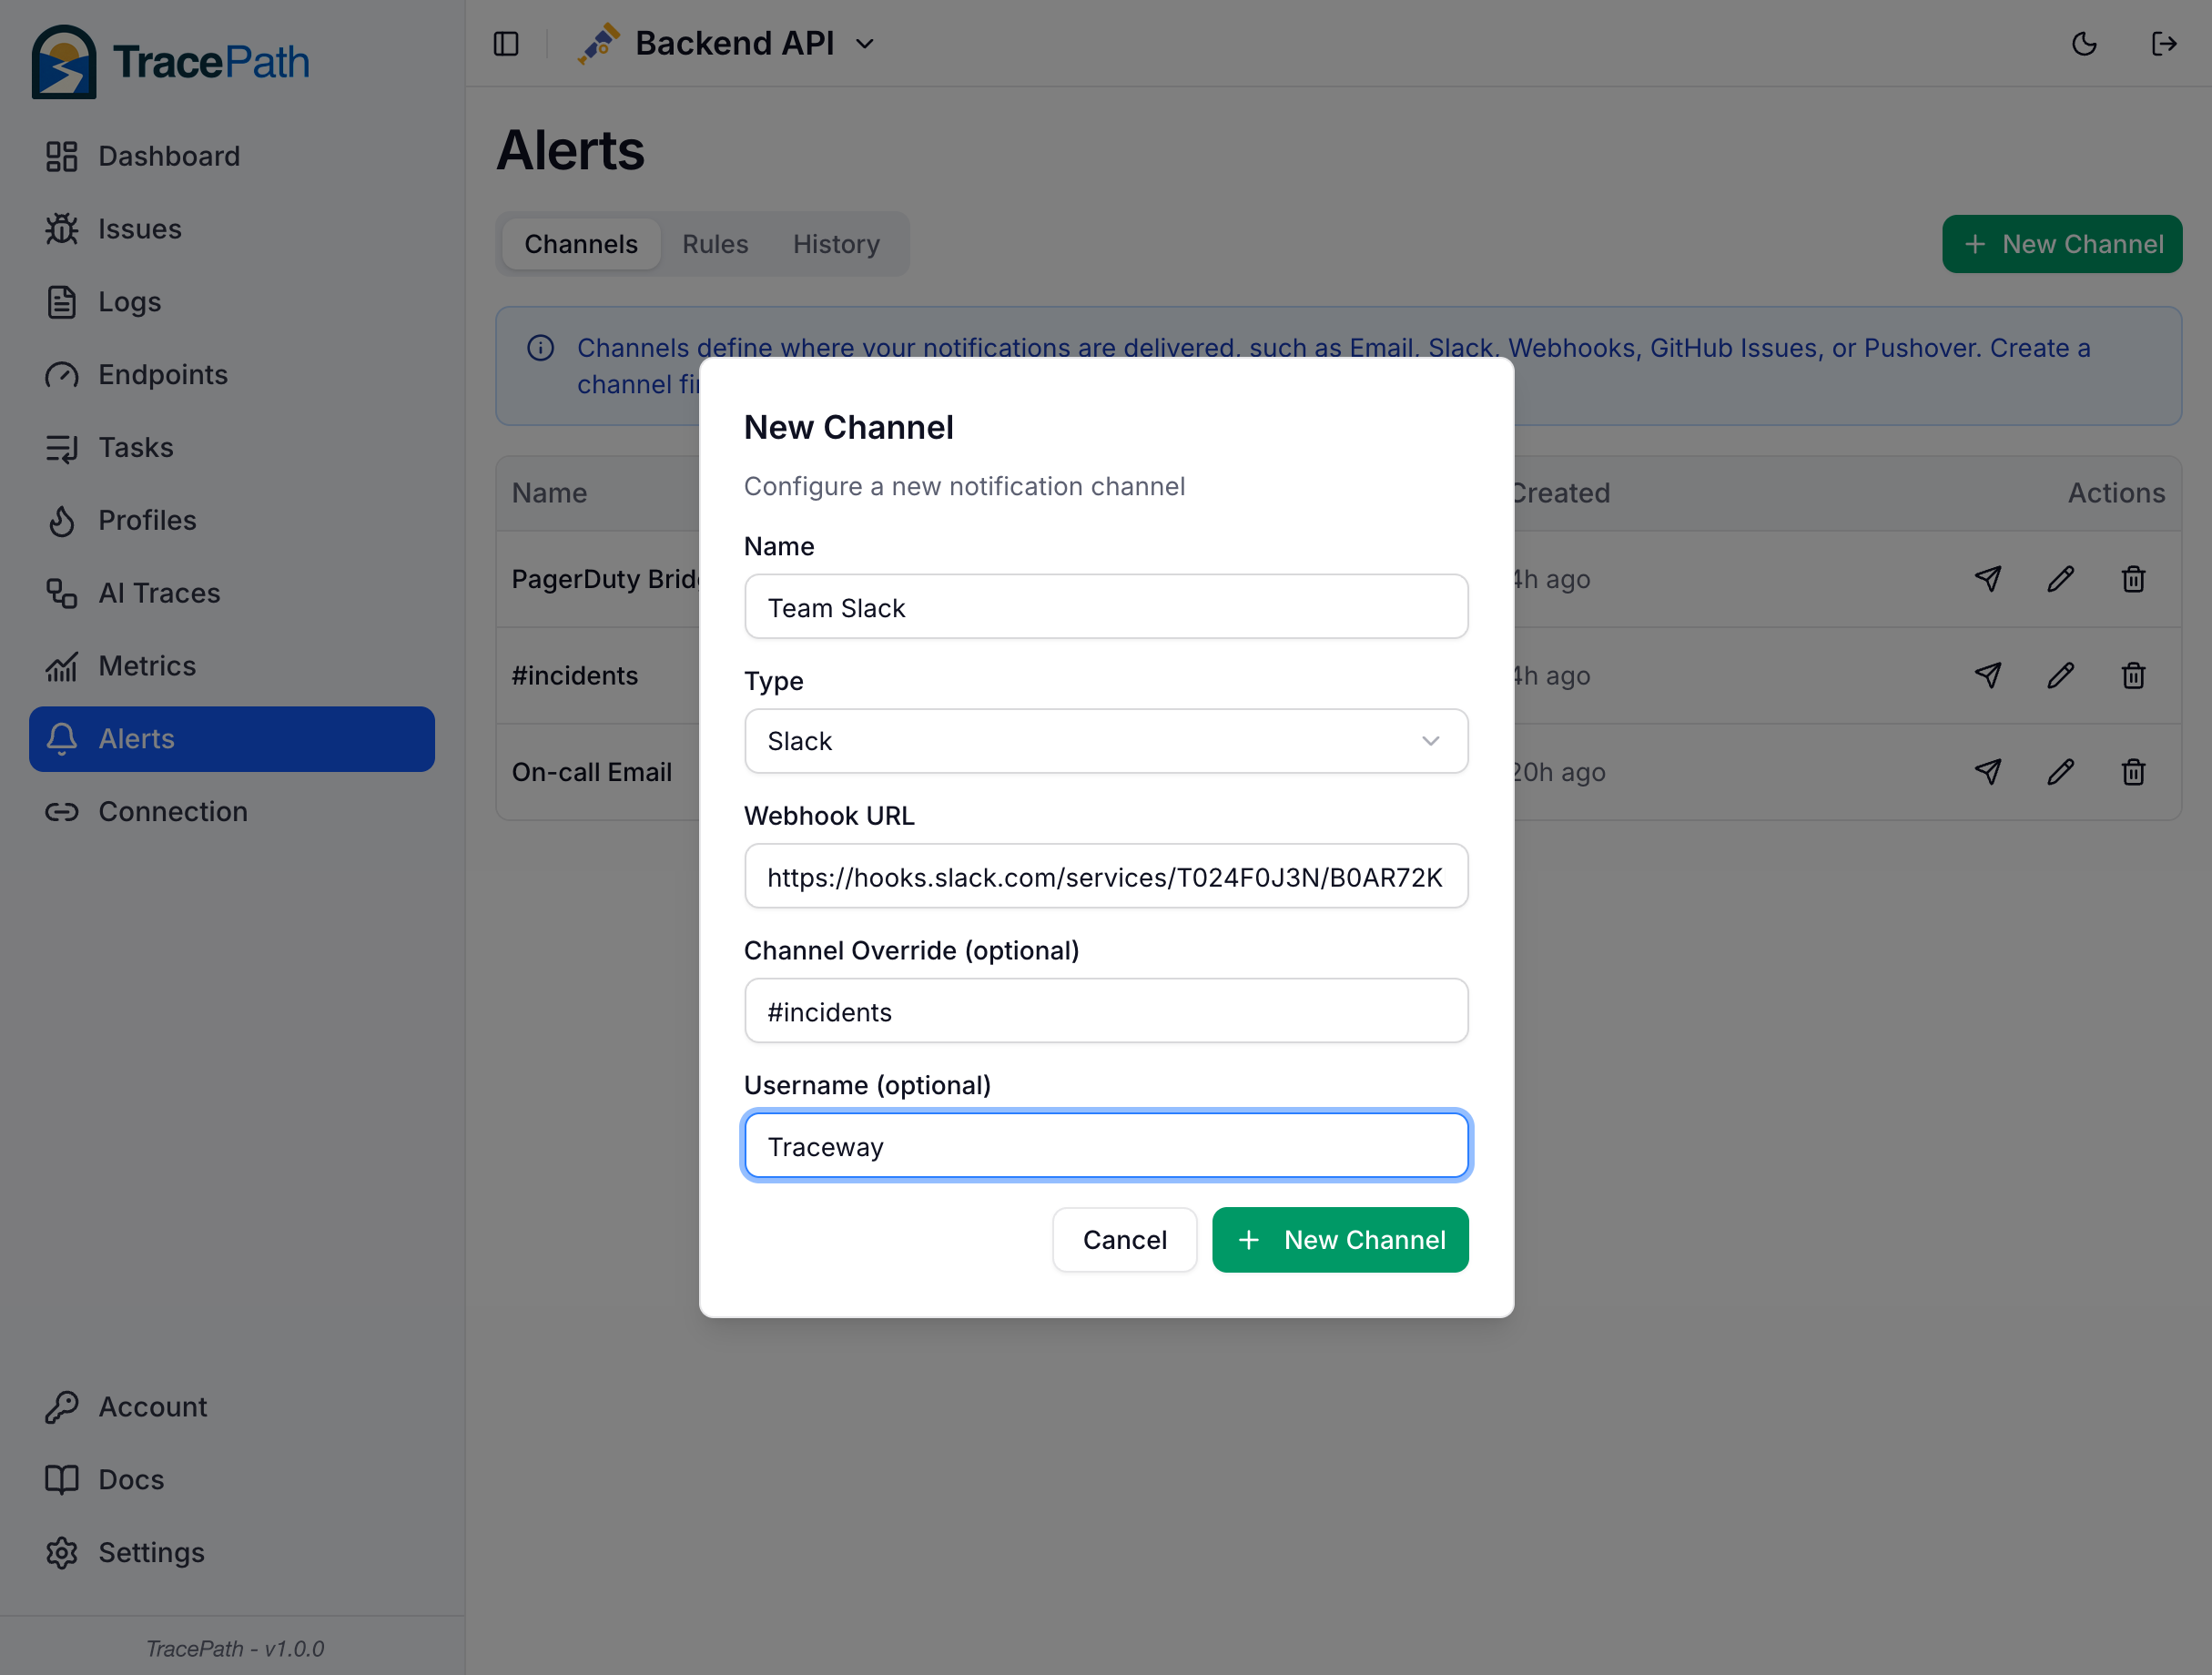
Then configure the Slack channel in TracePath:
| Field | Required | Description |
|---|---|---|
| Webhook URL | Yes | The URL you copied from Slack |
| Channel Override | No | Post to a different channel than the webhook default (e.g. #incidents) |
| Username | No | Override the bot display name (defaults to your Slack app name) |
Setting Up GitHub
To create GitHub issues from alerts, you need a Personal Access Token with issue permissions:
- Go to GitHub Settings → Developer settings → Personal access tokens → Fine-grained tokens (opens in a new tab)
- Click Generate new token
- Under Resource owner, select the account or organization that owns the target repository. If your organization doesn't appear, an org admin needs to enable fine-grained tokens under Organization Settings → Third-party access → Personal access tokens → Settings
- Set a descriptive name (e.g. "TracePath Alerts") and choose an expiration
- Under Repository access, select Only select repositories and choose the repo where issues should be created
- Under Permissions → Repository permissions, set Issues to Read and write
- Click Generate token and copy it; you won't be able to see it again
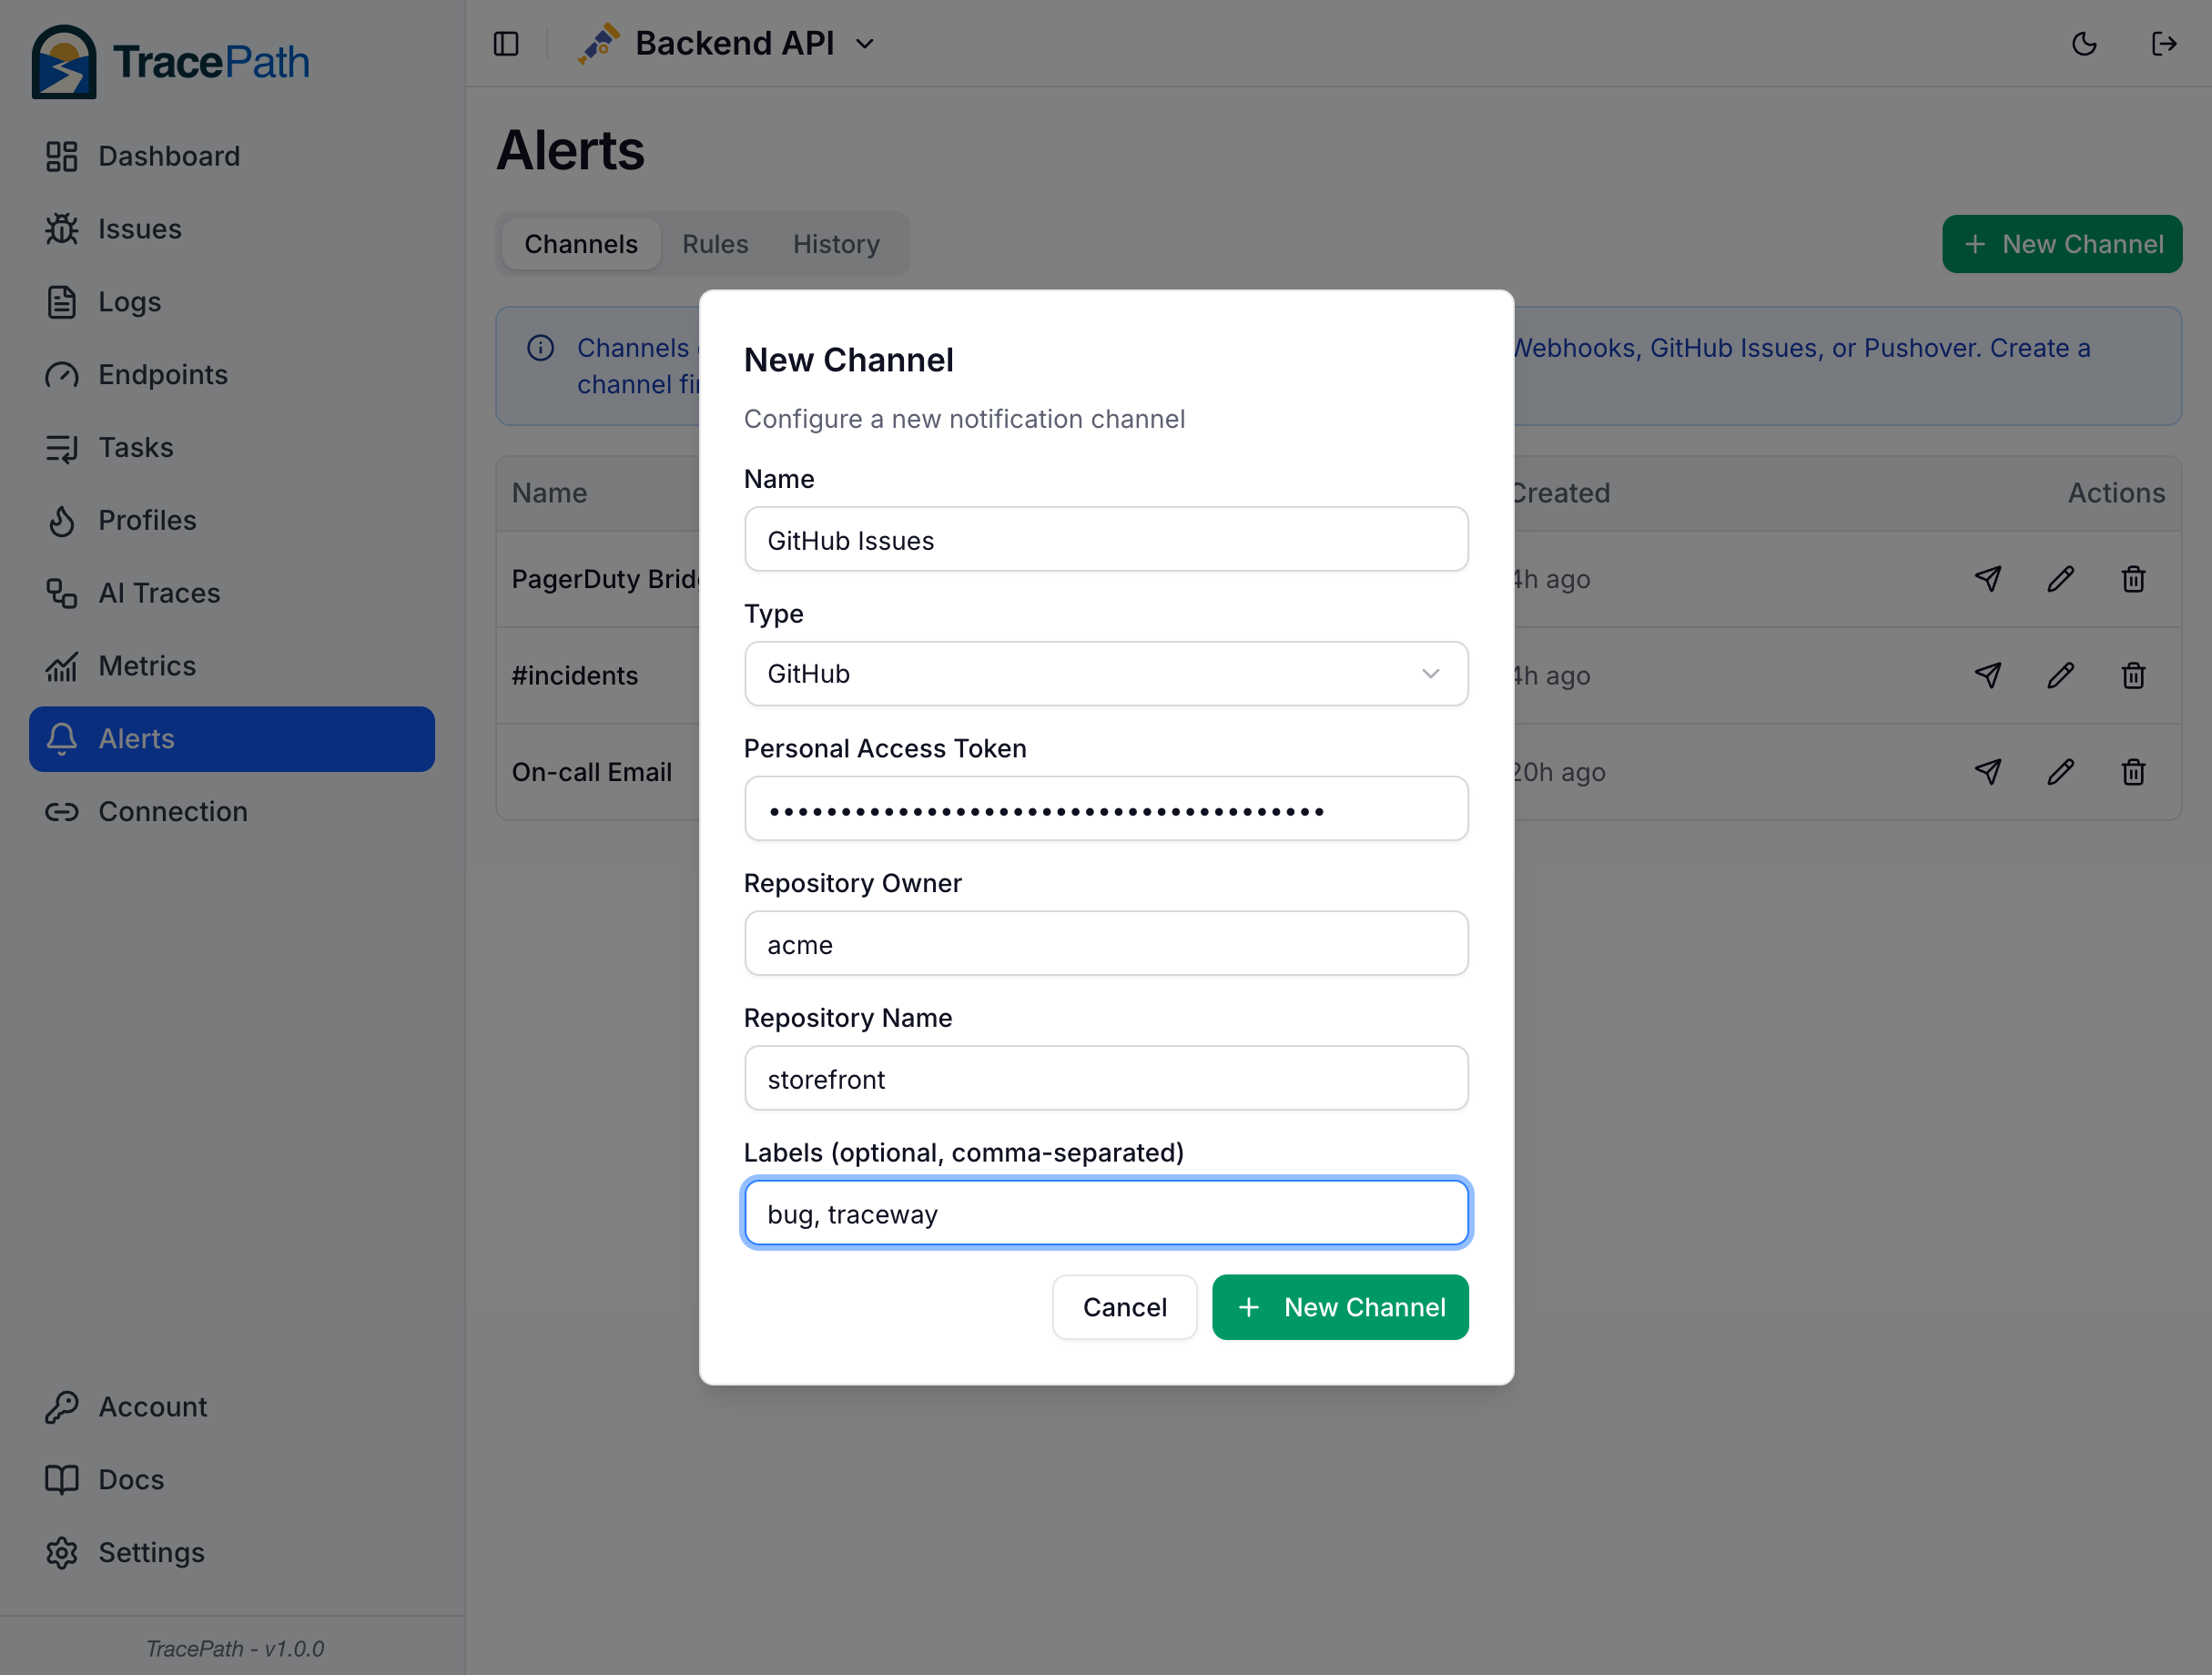
Then configure the GitHub channel in TracePath:
| Field | Required | Description |
|---|---|---|
| Personal Access Token | Yes | The fine-grained token you generated |
| Owner | Yes | The repository owner (user or organization), e.g. my-org |
| Repo | Yes | The repository name, e.g. backend |
| Labels | No | Comma-separated labels to apply to created issues, e.g. bug,tracepath |
Issues opened by this channel can start an AI coding agent in the repository's own GitHub Actions, which investigates the exception against the TracePath API and opens a pull request or comments its analysis. See Auto-Fix.
Setting Up Telegram
To send alerts to Telegram, you need a Bot Token and a Chat ID:
- Open Telegram and start a chat with @BotFather (opens in a new tab). Send
/newbotand follow the prompts to give your bot a name and username. BotFather will reply with a Bot Token in the form123456789:ABCdefGhIJKlmNoPQRstuVwxyZ. Copy it. - Open a chat with your new bot and send it
/startso it is allowed to message you. - Create a private channel in Telegram for the alerts.
- Open the channel's settings → Administrators → Add Admin, search for your bot's username, and add it with permission to post messages.
- Forward any message from the channel to @userinfobot (opens in a new tab); it will reply with the channel's Chat ID (a negative number, e.g.
-1001234567890). Copy it including the minus sign.
Then configure the Telegram channel in TracePath:
| Field | Required | Description |
|---|---|---|
| Bot Token | Yes | The token BotFather gave you |
| Chat ID | Yes | The destination channel ID (e.g. -1001234567890) |
Webhook Payload
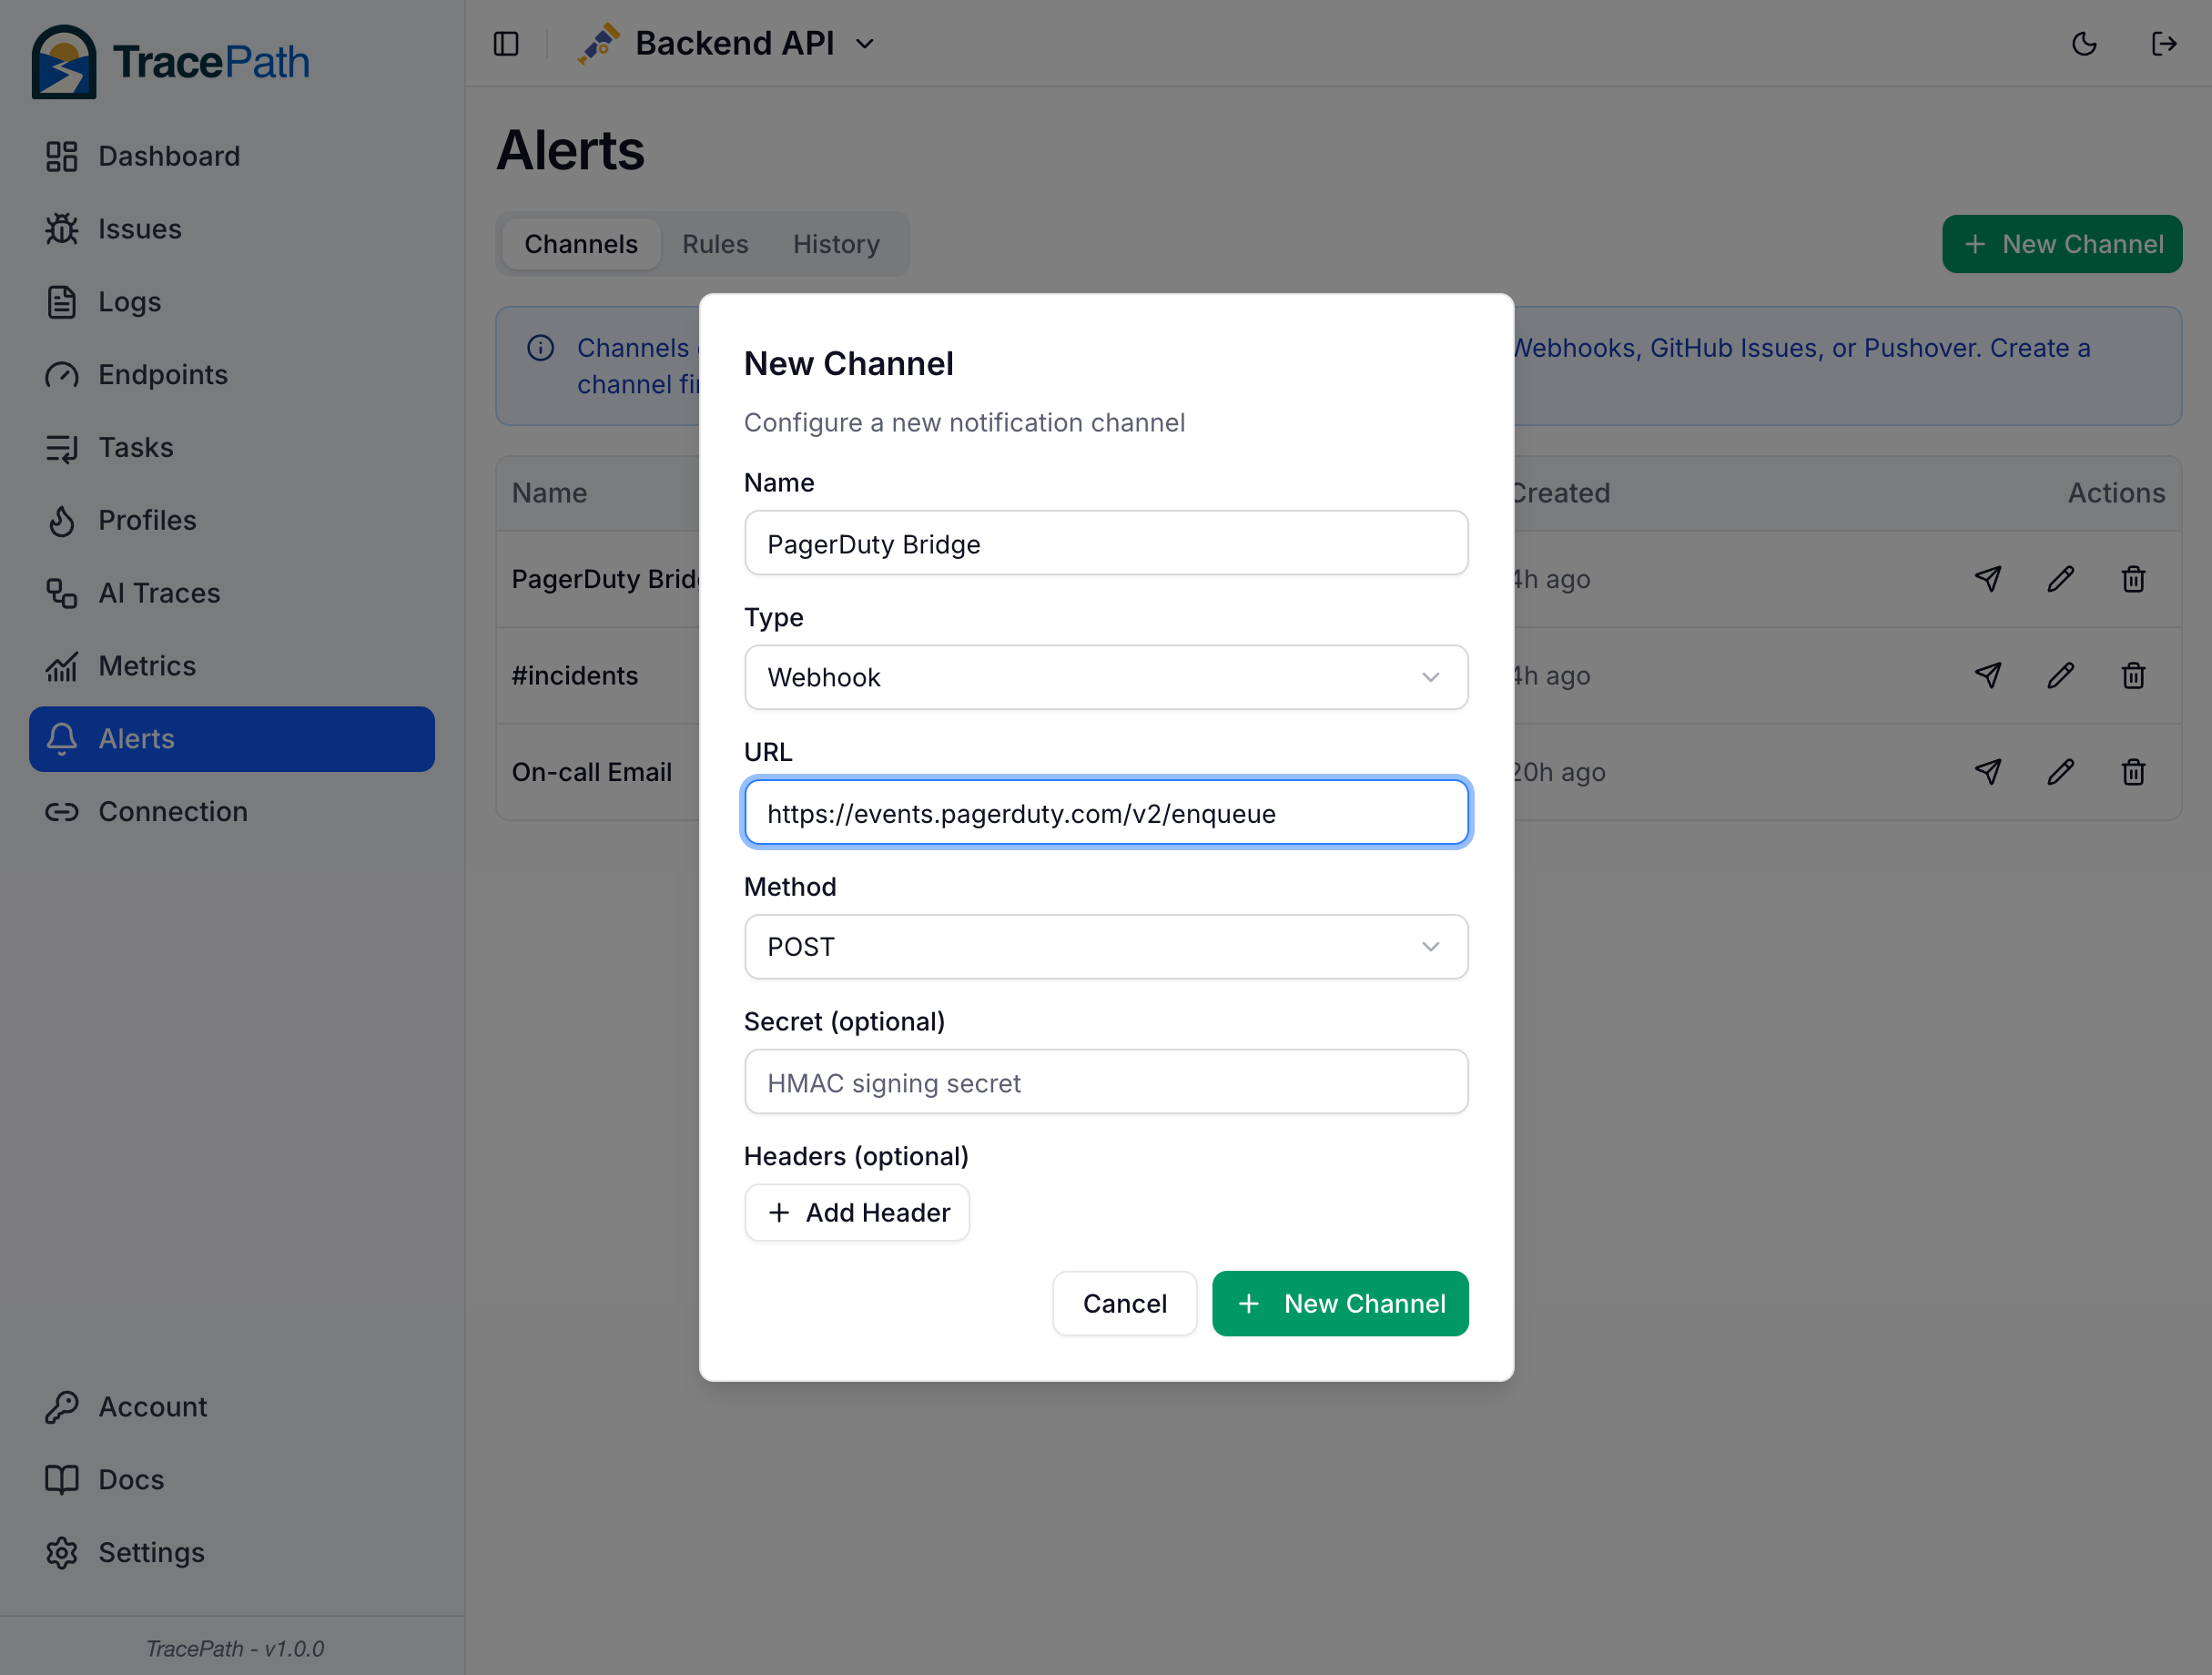
When a webhook channel fires, TracePath sends a JSON POST request with the following fields:
| Field | Description |
|---|---|
subject | Alert title |
body | Alert details |
severity | info, warning, or critical |
ruleType | The rule type that triggered the alert |
ruleName | The name you gave the rule |
url | Absolute deep link to the relevant dashboard page, for example https://app.tracepath.dev/issues/<hash> |
timestamp | When the alert fired (ISO 8601) |
If you configure an HMAC secret on the channel, each request includes an X-TracePath-Signature header containing sha256=<hex> of the request body, which you can use to verify that the request came from TracePath.
Rules
A rule connects a condition to a channel. Every rule has:
| Setting | Description |
|---|---|
| Name | A label you choose, included in notifications |
| Type | One of the rule types below, with type-specific configuration |
| Channel | The channel notifications are delivered through (exactly one per rule) |
| Cooldown | Minimum time between notifications for the same condition (default 15 minutes) |
| Severity | Auto (derived from the condition) or an explicit override |
Rules belong to a project and only evaluate that project's data. Frontend projects only support the New Issue rule type; all other types monitor backend telemetry.
Rule Types
| Rule | Fires When | Evaluation |
|---|---|---|
| New Issue | A never-before-seen error appears | On ingest |
| Error Regression | A resolved (archived) error reappears | On ingest |
| Error Rate | The 5xx rate across all endpoints exceeds a percentage | Polled |
| Error Count | Total errors in a window reach a count | Polled |
| Endpoint Error Rate | One endpoint's 5xx rate exceeds a percentage | Polled |
| Endpoint P95 / P99 | Latency percentile exceeds a millisecond threshold | Polled |
| Apdex Drop | The Apdex score falls below a threshold | Polled |
| Throughput Drop | Request volume drops versus the preceding baseline | Polled |
| Impact Score | An endpoint newly crosses an impact level | Polled |
| Task Duration | A background task's P95 duration exceeds a threshold | Polled |
| Task Failure Rate | The share of failed task executions exceeds a percentage | Polled |
| Metric Threshold | An aggregated metric violates a comparison | Polled |
| No Data | No telemetry received for a configured duration | Polled |
| AI Trace Cost | A single AI trace exceeds a cost threshold | On ingest |
| AI Conversation Cost | A conversation's cumulative 24-hour cost exceeds a threshold | On ingest |
| AI Flagged Content | An AI conversation matches a flagged content term | On ingest |
| Monitor Down | A monitor crosses its failure threshold | On state change |
New Issue
Fires the first time an error with a given fingerprint is seen. Errors are grouped by a normalized stack trace hash, so the same logical error reported many times produces a single alert rather than one per occurrence. If you archive an issue and it occurs again, that first re-occurrence counts as new and fires the rule.
The notification includes the error type, stack trace, app version, server name, the endpoint or task it occurred on, and a deep link to the issue.
| Option | Default | Description |
|---|---|---|
| Ignore Patterns | empty | Comma-separated, case-insensitive substring matches against the error type, e.g. *timeout*, *context canceled*. Matching errors never alert. |
The cooldown applies per error, not per rule: two different new errors arriving a minute apart both alert, but the same error will not alert again until its cooldown expires.
Error Regression
Fires when an error whose issue was archived (resolved) occurs again. Regressions are detected by the same grouping, so the alert means the same failure is back, not that a similar-looking one appeared. Use this to catch fixes that did not stick. The cooldown applies per error. There is no extra configuration.
Error Rate
Fires when the percentage of requests returning a 5xx status across all endpoints exceeds the threshold within the lookback window.
| Option | Default | Description |
|---|---|---|
| Threshold % | 5 | Error rate that triggers the alert |
| Lookback Minutes | 5 | Window the rate is computed over |
| Min Requests | 10 | Minimum requests in the window; below this the rule never fires, which avoids noise from a single failed request in quiet periods |
Error Count
Fires when the total number of errors recorded in the lookback window reaches the threshold. Captured messages (log-style events without an exception) are not counted.
| Option | Default | Description |
|---|---|---|
| Threshold Count | 100 | Number of errors that triggers the alert |
| Lookback Minutes | 60 | Window the count is computed over |
Endpoint Error Rate
Like Error Rate, but scoped to a single endpoint.
| Option | Default | Description |
|---|---|---|
| Endpoint | The endpoint to monitor, e.g. GET /api/users | |
| Threshold % | 2 | Error rate that triggers the alert |
| Lookback Minutes | 10 | Window the rate is computed over |
| Min Requests | 20 | Minimum requests in the window before the rule can fire |
Endpoint P95 / P99
Fires when the P95 (or P99) response time over the lookback window exceeds the threshold. Two separate rule types so you can alert on each percentile independently.
| Option | Default | Description |
|---|---|---|
| Endpoint | * | A specific endpoint, or * for all endpoints combined |
| Threshold ms | 500 | Latency that triggers the alert |
| Lookback Minutes | 5 | Window the percentile is computed over |
Apdex Drop
Fires when the Apdex score over the lookback window falls below the threshold. TracePath computes Apdex with fixed bands: requests up to 750 ms are satisfied, up to 1500 ms are tolerating, and anything slower or returning 5xx is bad. The score is (satisfied + tolerating / 2) / total, so 1.0 is perfect and anything below roughly 0.85 means users are noticing.
| Option | Default | Description |
|---|---|---|
| Threshold Apdex | 0.85 | Score below which the alert fires |
| Lookback Minutes | 15 | Window the score is computed over |
| Min Requests | 50 | Minimum requests in the window before the rule can fire |
Throughput Drop
Fires when request volume in the lookback window drops by more than the configured percentage compared to the baseline window that immediately precedes it. The baseline count is normalized to the lookback length, so a 15-minute window is compared against the expected 15-minute share of a 60-minute baseline. If the baseline window has no traffic at all, the rule does not fire.
| Option | Default | Description |
|---|---|---|
| Drop % | 50 | Drop versus the normalized baseline that triggers the alert |
| Lookback Minutes | 15 | The current window being measured |
| Baseline Window Minutes | 60 | The preceding window used as the baseline |
Impact Score (Critical / High / Medium)
Fires when an endpoint's impact score crosses into the configured level. The impact score is a 0 to 1 rating computed over the trailing 24 hours as the worst of five components: Apdex degradation, server error rate, P99 latency, client error rate, and error volume. Medium starts at 0.25, High at 0.50, and Critical at 0.75. Streaming endpoints are excluded.
These rules are transition-based: they fire once when an endpoint newly enters the level, not continuously while it stays there. The endpoint alerts again only if it drops out of the level and later crosses back in. After a server restart the first evaluation establishes a baseline without firing.
The notification names the endpoint, its score, and the dominant reason (for example a P99 of 9.2 s, or a 12% server error rate).
| Option | Default | Description |
|---|---|---|
| Min Requests | 50 | Endpoints with fewer requests in 24 hours are ignored |
Task Duration
Fires when the P95 duration of background task executions over the lookback window exceeds the threshold.
| Option | Default | Description |
|---|---|---|
| Task Name | * | A specific task, or * for all tasks combined |
| Threshold ms | 30000 | P95 duration that triggers the alert |
| Lookback Minutes | 30 | Window the percentile is computed over |
Task Failure Rate
Fires when the percentage of task executions that recorded an error exceeds the threshold. An execution counts as failed when at least one exception was captured during it, so one execution with three errors counts once.
| Option | Default | Description |
|---|---|---|
| Task Name | * | A specific task, or * for all tasks combined |
| Threshold % | 10 | Failure rate that triggers the alert |
| Lookback Minutes | 60 | Window the rate is computed over |
| Min Executions | 5 | Minimum executions in the window before the rule can fire |
Metric Threshold
Fires when an aggregated metric value violates the configured comparison over the lookback window. Works for both system metrics (cpu.used_pcnt, mem.used, ...) and custom metrics. If the window contains no data points the rule does not fire; pair it with a No Data rule if you also want to know when the metric stops reporting.
| Option | Default | Description |
|---|---|---|
| Metric Name | The metric to monitor | |
| Aggregation | avg | One of avg, max, min, sum, p95, p99, last (most recent value) |
| Operator | gt | One of gt, gte, lt, lte, eq |
| Threshold Value | 90 | The value compared against the aggregate |
| Lookback Minutes | 5 | Window the aggregate is computed over |
The aggregation spans every series of the metric name, with no tag filter. For metrics tagged per host, per disk, or per table, an avg can hide one bad series behind healthy ones; prefer max (or min for lower-is-bad metrics) so the worst series drives the alert.
No Data
Fires when no telemetry of the selected kind has been received for the configured number of minutes. Use it to detect a stopped service, a broken deploy, or a misconfigured SDK rather than an application-level problem.
| Option | Default | Description |
|---|---|---|
| Data Type | any | One of any, endpoints, exceptions, metrics, tasks. any fires only when all four kinds are silent |
| Silence Minutes | 10 | How long the data must be absent before the alert fires |
AI Trace Cost
Fires when a single AI trace exceeds a cost threshold, catching runaway agent loops or unexpectedly expensive calls as they are ingested rather than at the end of the month.
| Option | Default | Description |
|---|---|---|
| Trace Name | * | A specific trace name, or * for all traces |
| Threshold Cost | 0.5 | Cost in USD a single trace must reach to trigger the alert |
The cooldown applies per trace name, so two different expensive workflows alert independently.
AI Conversation Cost
Fires when the cumulative cost of a single AI conversation over the last 24 hours crosses the threshold. Where AI Trace Cost catches one expensive call, this catches sessions that get expensive gradually: a runaway agent loop of cheap calls, or a user hammering an assistant.
| Option | Default | Description |
|---|---|---|
| Cost Threshold | 5 | Cumulative cost in USD a conversation must reach within 24 hours to trigger the alert |
The cooldown applies per conversation, so one noisy conversation alerts once per cooldown window while a second conversation crossing the threshold still alerts immediately.
AI Flagged Content
Fires when an AI conversation matches a flagged content term. Matching happens at ingest against the language packs selected in the project's AI settings plus your custom terms, so the alert carries the matched terms.
| Option | Default | Description |
|---|---|---|
| Terms | all | Optional comma-separated list to narrow the rule to specific terms; empty fires on any flagged match |
Monitor Down
Fires when a monitor transitions to down, which happens only after its configured number of consecutive failures, and sends a recovery notice when it comes back up. One rule covers every monitor in the project; the alert names the monitor and carries the last probe error.
There are no rule-specific options. Pointing the rule at an escalation channel opens an on-call page instead of sending a message: the page deduplicates per monitor, re-fires never restart its escalation clock, and recovery resolves it automatically.
Evaluation Model and Cost
Rules are evaluated in one of three ways:
- On ingest (New Issue, Error Regression, AI Trace Cost, AI Conversation Cost, AI Flagged Content): evaluated immediately as reports arrive, so alerts fire within seconds of the triggering event.
- On state change (Monitor Down): fires the moment a probe result flips the monitor's up/down state, independent of any poll interval.
- Polled (everything else): a background loop evaluates all enabled polled rules on a 60-second interval, so detection latency for a polled rule is at most one minute.
Each rule type does a different amount of work per evaluation. It does not change your bill — rule evaluation is not metered — but it is worth knowing when a project carries dozens of rules over a lot of data, because the cheapest rule that answers your question is also the one that fires soonest:
| Rule | Work per evaluation | Relative cost |
|---|---|---|
| AI Trace Cost | In-memory check of the ingested batch, no queries | Minimal |
| AI Flagged Content | In-memory check of flags set at ingest, no queries | Minimal |
| Monitor Down | In-memory on the state transition, no queries | Minimal |
| AI Conversation Cost | One 24-hour cost sum per conversation in the batch | Low |
| New Issue | 1 to 3 indexed lookups per distinct new error in the batch | Low |
| Error Regression | 1 indexed lookup per distinct error in the batch | Low |
| Error Rate | One aggregate over the lookback window | Low |
| Error Count | One count over the lookback window | Low |
| Endpoint Error Rate | One aggregate over one endpoint's window | Low |
| Endpoint P95 / P99 | One percentile over the lookback window | Low |
| Apdex Drop | One aggregate over the lookback window | Low |
| Metric Threshold | One aggregate over one metric's window | Low |
| No Data | One freshness check per data type, up to four for any | Low |
| Task Duration | One percentile over the lookback window | Low |
| Throughput Drop | Two counts: lookback plus baseline window | Low |
| Task Failure Rate | Two queries joining tasks and exceptions over the window | Moderate |
| Impact Score | One scan of the trailing 24 hours of requests | Highest |
Cost-relevant behavior:
- Rules that are snoozed or still in cooldown are skipped entirely, including their queries. Longer cooldowns directly reduce evaluation load.
- The three Impact Score levels share one 24-hour scan per project per poll cycle through a 30-second cache, so adding all three costs the same as adding one.
- On-ingest rules deduplicate per error hash, so a busy error stops generating lookups once it has alerted until its cooldown expires.
- Polled query cost scales with the lookback window. The defaults keep windows short; a 24-hour lookback on a high-traffic project costs proportionally more.
Cooldown and Snooze
Cooldown prevents a rule from firing repeatedly for the same ongoing condition. The default is 15 minutes, configurable per rule.
- For polled rules the cooldown is rule-wide: after a notification is delivered, the rule is not evaluated again until the cooldown expires.
- For on-ingest rules the cooldown is per condition: per error hash for New Issue and Error Regression, per trace name for AI Trace Cost. Different errors can alert back-to-back; the same error cannot.
Rule-level cooldowns are persisted with the notification history, so a platform restart does not cause every rule to re-fire. Per-error cooldown state is held in memory, so an already-alerted error can alert once more after a restart — the failure mode is one duplicate, never a missed alert. Editing a rule resets its cooldown and per-error state so the new configuration takes effect immediately.
Snooze temporarily mutes a rule for a set duration from the dashboard. Snoozed rules are not evaluated at all. Use it during deployments, maintenance windows, or known incidents.
Severity
Each rule has a Severity setting that controls the severity attached to its notifications. The default is Auto, which derives severity from how badly the condition is violated:
| Rule | Auto Severity |
|---|---|
| New Issue | Critical |
| Error Regression | Critical |
| No Data | Critical |
| Error Rate | Warning; Critical at twice the threshold |
| Error Count | Warning; Critical at five times the threshold |
| Endpoint Error Rate | Warning; Critical at twice the threshold |
| Endpoint P95 / P99 | Warning |
| Apdex Drop | Warning; Critical when Apdex falls below 0.5 |
| Throughput Drop | Warning; Critical at an 80% drop or more |
| Impact Score Critical | Critical |
| Impact Score High | Warning |
| Impact Score Medium | Info |
| Task Duration | Warning |
| Task Failure Rate | Warning; Critical at twice the threshold |
| Metric Threshold | Warning; Critical when the value deviates from the threshold by more than 20% |
| AI Trace Cost | Warning; Critical at three times the threshold |
You can override the automatic severity by setting it explicitly on a rule to Critical, Warning, or Info. This is useful when you want a normally-warning condition to page as critical, or to downgrade noisy rules to info.
History
All fired notifications are recorded and visible in the History tab on the Alerts page. Each entry shows:
| Field | Description |
|---|---|
| Severity | Critical, warning, or info |
| Rule Name | The rule that triggered |
| Subject | Alert title summarizing the condition |
| Channel | Which channel delivered the notification |
| Status | Whether delivery succeeded or failed |
| Timestamp | When the notification was sent |