Metrics
Metrics are time-series measurements that track your application's health and behaviour over time. They arrive over OTLP/HTTP like every other signal, from three places: the OpenTelemetry SDK in your application, a host agent or Kubernetes collector scraping the machine, and any instrumentation library that ships metrics of its own. Which metrics appear automatically depends entirely on which OpenTelemetry instrumentation you enable; TracePath stores whatever you export.
Metric Structure
Each metric point contains:
| Field | Description |
|---|---|
| Name | Dot-separated identifier (e.g. cpu.used_pcnt) |
| Value | Numeric measurement (float64) |
| Tags | Key-value metadata (e.g. server_name: "web-1") |
| Timestamp | When the measurement was taken |
Automatic vs Custom Metrics
Automatic metrics are collected without any code changes. With OpenTelemetry the set depends on your SDK and instrumentation libraries: the Go OTel runtime instrumentation provides goroutine and memory metrics, the Node.js OTel runtime instrumentation provides event loop and heap metrics. For host-level CPU, memory, disk and network, run an OpenTelemetry host agent.
Custom metrics are recorded in your application code with an OTel meter (createCounter, createHistogram, createObservableGauge). Use these for business metrics (orders per minute), resource metrics (queue depth), or performance metrics (external API latency).
See OTel Metrics for the mapping and per-language examples, and the Node.js metrics guide for a full worked setup.
Tags
Tags are key-value pairs attached to individual metric points. They enable filtering and grouping in the dashboard.
Common tags include:
| Tag | Example Values | Use Case |
|---|---|---|
server_name | web-1, web-2 | Compare metrics across servers |
region | us-east-1, eu-west | Regional breakdowns |
queue_name | emails, payments | Per-queue monitoring |
environment | production, staging | Environment comparison |
Tags come from the data-point attributes you pass when recording a value, plus the small allowlist of resource attributes TracePath lifts. See Resource Attributes.
Visualizing Metrics
Server metrics also drive the Servers page of the Organization Overview, which reads system.cpu.utilization, system.memory.utilization, system.filesystem.utilization and system.network.io per server_name.
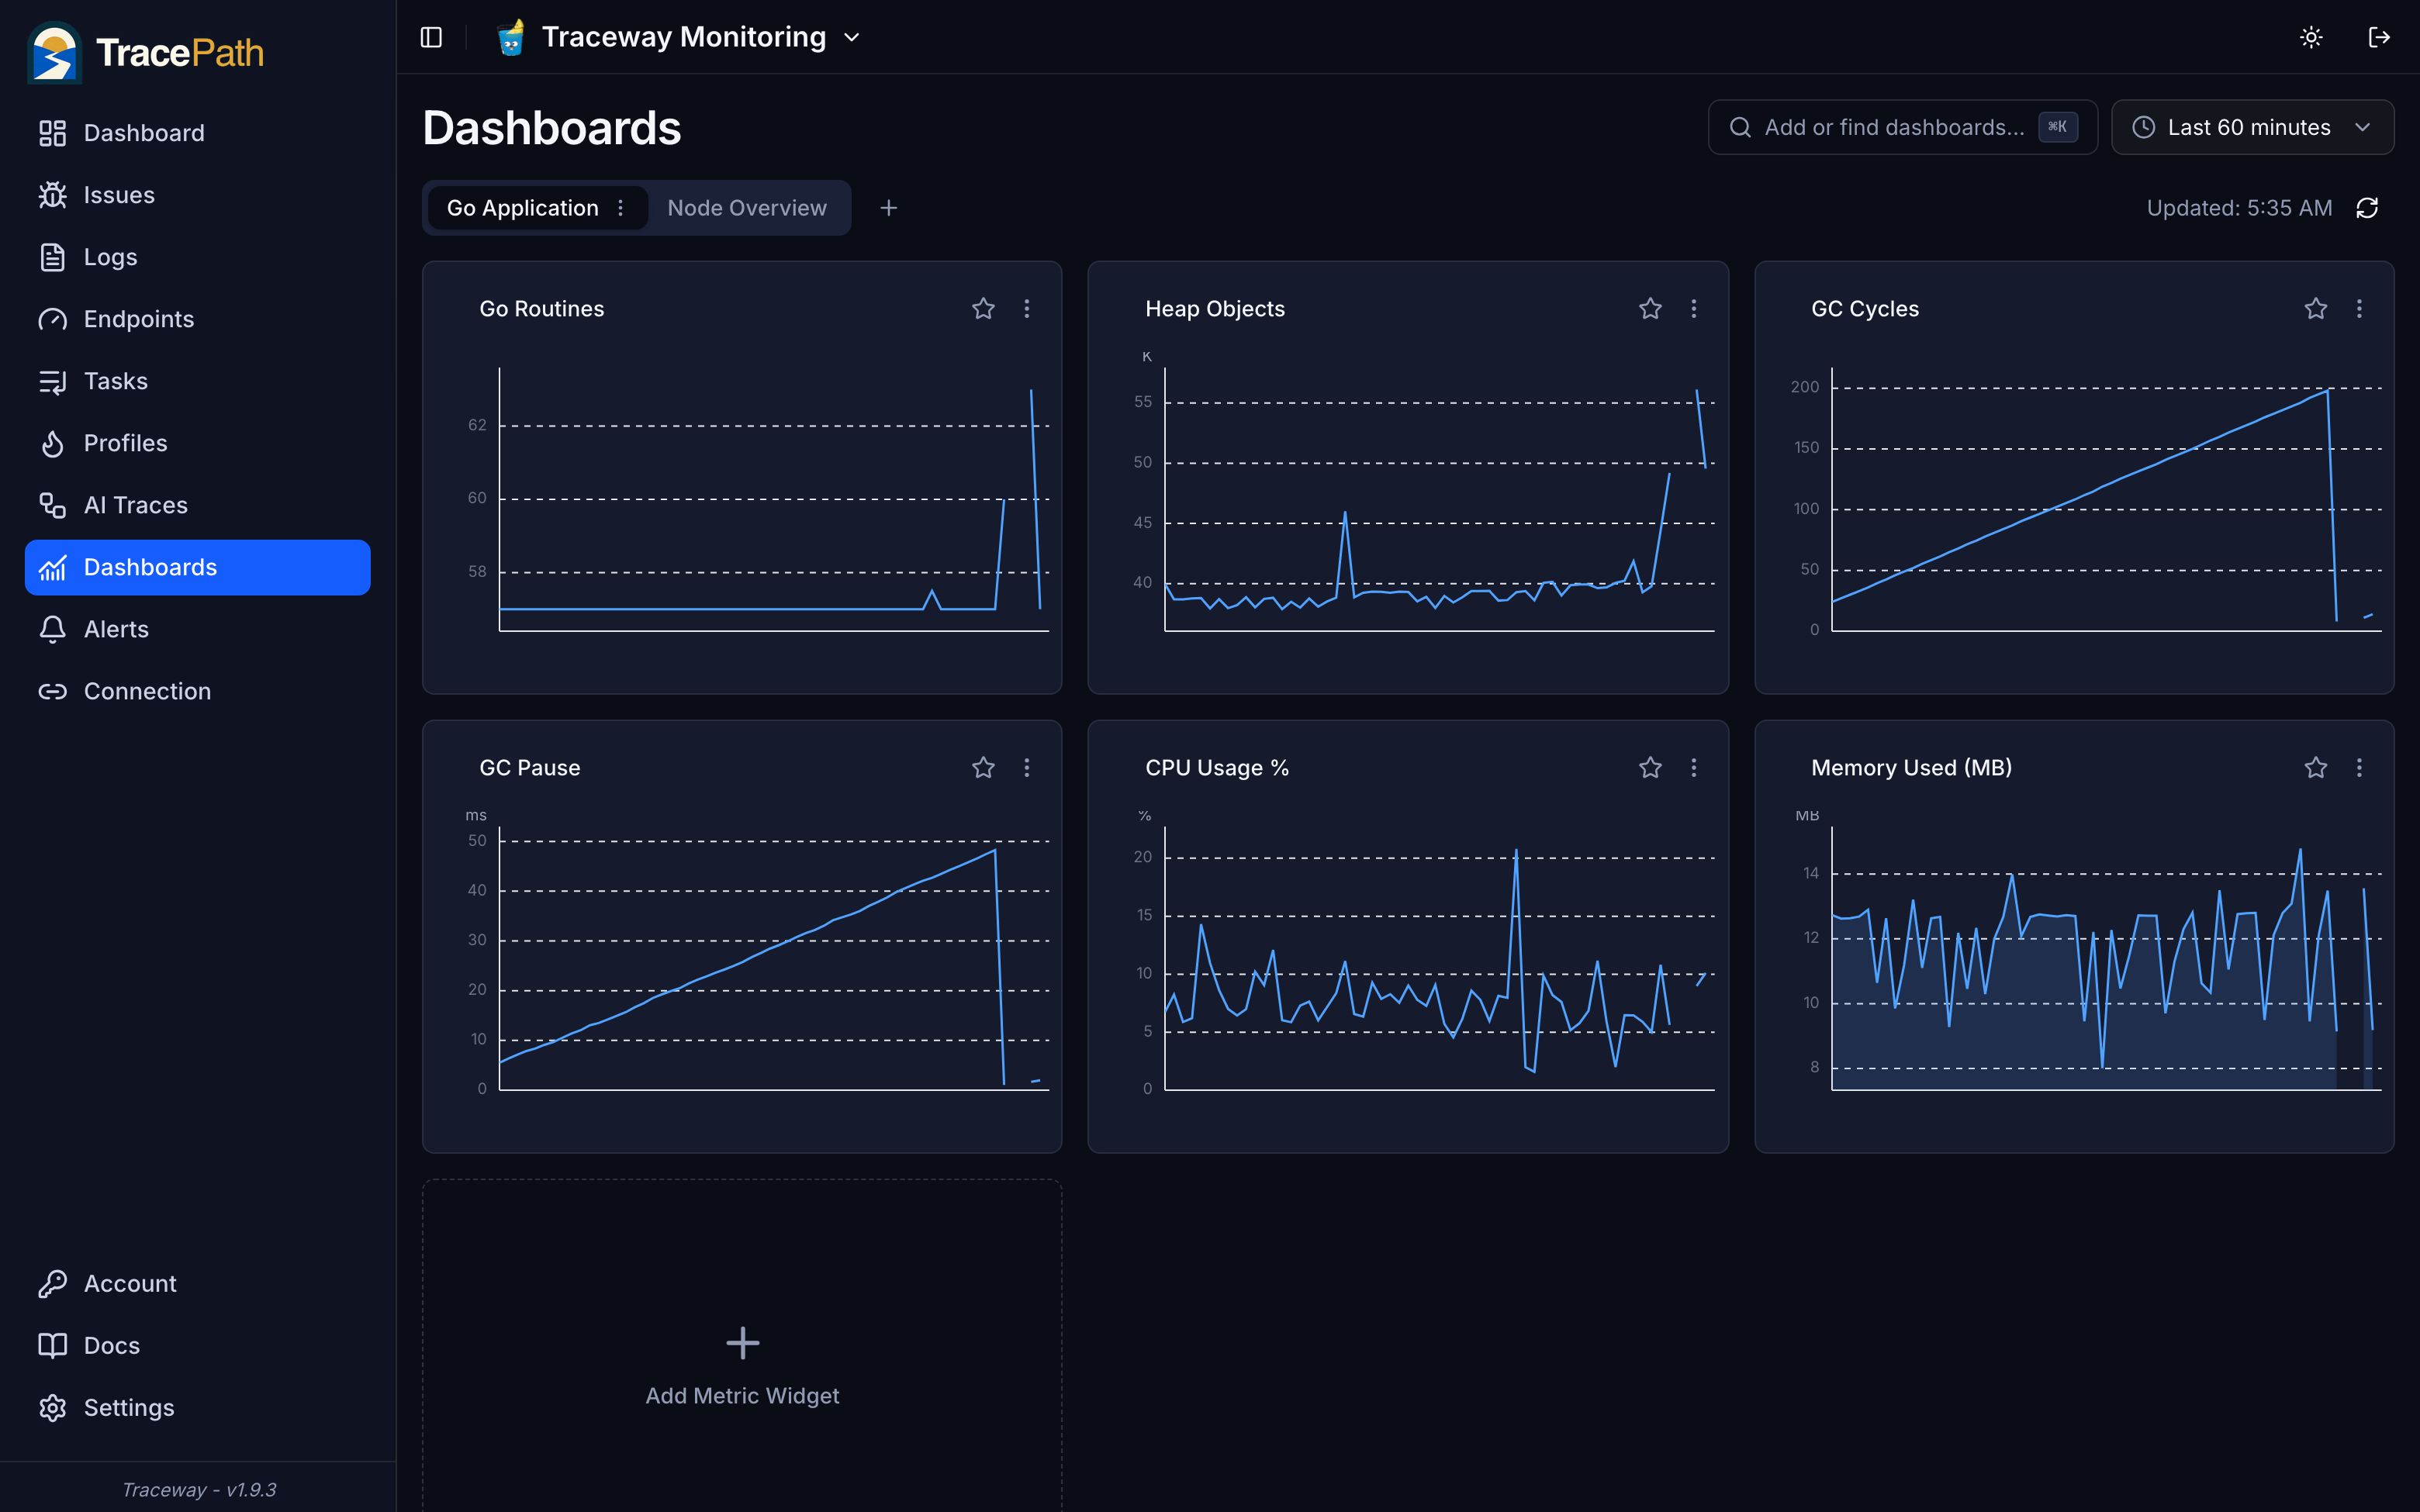
Metrics are visualized on Dashboards: organization-owned, JSON-defined tabs of chart widgets that you can apply to any of your projects, install from the built-in template marketplace (host metrics, Go runtime, TracePath self-monitoring), or import from Grafana.
Time Range
The dashboard supports preset time ranges (5m, 15m, 30m, 1h, 3h, 6h, 12h, 24h, 3d, 7d, 1M, 3M) and custom date/time ranges.
The backend automatically selects the optimal storage resolution based on the selected range:
| Range | Resolution |
|---|---|
| Up to 3 hours | Raw data points |
| 3h to 24h | 1-minute aggregates |
| 24h to 7 days | 1-hour aggregates |
| Over 7 days | 1-day aggregates |
This keeps queries fast regardless of the time window.
Creating Your First Dashboard
- Open the Dashboards page and press ⌘K (or click Add or find dashboards...) to install a template, pick up a dashboard from another project, or create a blank one
- Add a widget: Click Add Metric Widget, pick a metric from the dropdown, choose an aggregation, and optionally add tag filters or a group-by
- Adjust the time range: Use the preset buttons or select a custom range to see the data window you need
- Interact: Hover over data points for exact values, drag-select a region to zoom in, and use the widget menu to move, edit, or delete widgets
See Dashboards for applying dashboards across projects, editing them as JSON, and importing from Grafana.
Host-level metrics
To collect host-level metrics (CPU, memory, disk, network, filesystem, processes) from a server and ship them to a TracePath project with a one-line install, see the OTel Agent.