AI Tracing
AI Tracing lets you monitor LLM and AI model calls across your application. Every API call to an AI provider, whether it's OpenAI, Anthropic, Cohere, or any model routed through OpenRouter, is captured as an AI trace with full cost, token usage, and conversation data.
Why AI Observability Matters
AI API calls are fundamentally different from traditional HTTP requests:
- Costs are unpredictable. A single prompt with a large context window can cost 100x more than average. Without visibility, cost spikes go unnoticed until the invoice arrives.
- Latency varies wildly. The same model can respond in 500ms or 30 seconds depending on prompt length, model load, and provider routing. You need P50/P95 breakdowns to understand real-world performance.
- Token usage drives cost. Input and output tokens are billed separately at different rates. Cached tokens and reasoning tokens add further complexity. You need per-call granularity.
- Prompt/completion quality matters. Seeing the actual conversation helps debug unexpected model behavior, hallucinations, or prompt injection issues.
- Provider reliability differs. When routing through multiple providers, you need to know which provider is slower, more expensive, or failing more often.
What Gets Captured
Every AI trace records:
| Field | Description |
|---|---|
| Model | The requested model (e.g., openai/gpt-4-turbo) |
| Provider | The AI provider (e.g., openai, anthropic) |
| Duration | End-to-end latency of the API call |
| Input Tokens | Tokens in the prompt |
| Output Tokens | Tokens in the completion |
| Total Tokens | Combined token count |
| Cached Tokens | Tokens served from cache (reduced cost) |
| Reasoning Tokens | Tokens used for chain-of-thought reasoning |
| Input Cost | Cost of the prompt |
| Output Cost | Cost of the completion |
| Total Cost | Combined cost |
| Finish Reason | Why the model stopped (e.g., stop, length) |
| User ID | The user who triggered the call |
| Conversation ID | Groups multi-turn conversations (see below) |
| Tool Calls | Count and names of tools the model invoked, parsed from the completion |
| Flagged Terms | Content-flag matches found in the prompt or completion at ingest |
| Conversation | Full input/output content (stored separately) |
How It Works
AI traces are ingested via the OpenTelemetry OTLP/HTTP endpoint. Any span carrying gen_ai.* semantic convention attributes is promoted to an AI trace, regardless of whether it's a root span or a child of an HTTP request, queue job, or scheduled task. This matters in practice: most LLM calls happen inside a request handler, so the gen_ai span is a child of a SERVER span. TracePath captures both.
One caveat: gen_ai.* is checked last. A span that already looks like an endpoint or a task wins first, so a SERVER span with HTTP attributes becomes an Endpoint and a CONSUMER span becomes a Task, even when both carry gen_ai.*. Neither reaches AI Traces. Put every model call on its own child span and the rule always matches. See Traces for the full ordered list.
The data flow:
- OTLP span arrives. From an AI provider broadcast (e.g. OpenRouter) or your own SDK instrumentation. The span contains
gen_ai.request.model,gen_ai.usage.input_tokens,gen_ai.usage.total_cost, and other standardized attributes. - TracePath promotes the span by attributes, not by position. If a span has
gen_ai.*attributes, it lands in the AI Traces table. Root spans use the OTel trace_id as their id; non-root child spans use their own span_id, so a request handler and the LLM call it made each get their own row without collision. - Conversation content stored separately. The full prompt and completion go to object storage rather than the telemetry database, which keeps the aggregation queries lean.
- Linked across the trace.
distributed_trace_idis auto-derived from the OTel trace_id, so a child AI trace and its parent endpoint show up together in the distributed-trace view with no extra configuration. - Dashboard shows aggregated view. AI traces are grouped by trace name (your agent or workflow identifier), with drill-down to individual calls. Groups containing non-root calls are flagged with a Non-root chip.
Three-Level Drill-Down
AI traces follow the same drill-down pattern as endpoints:
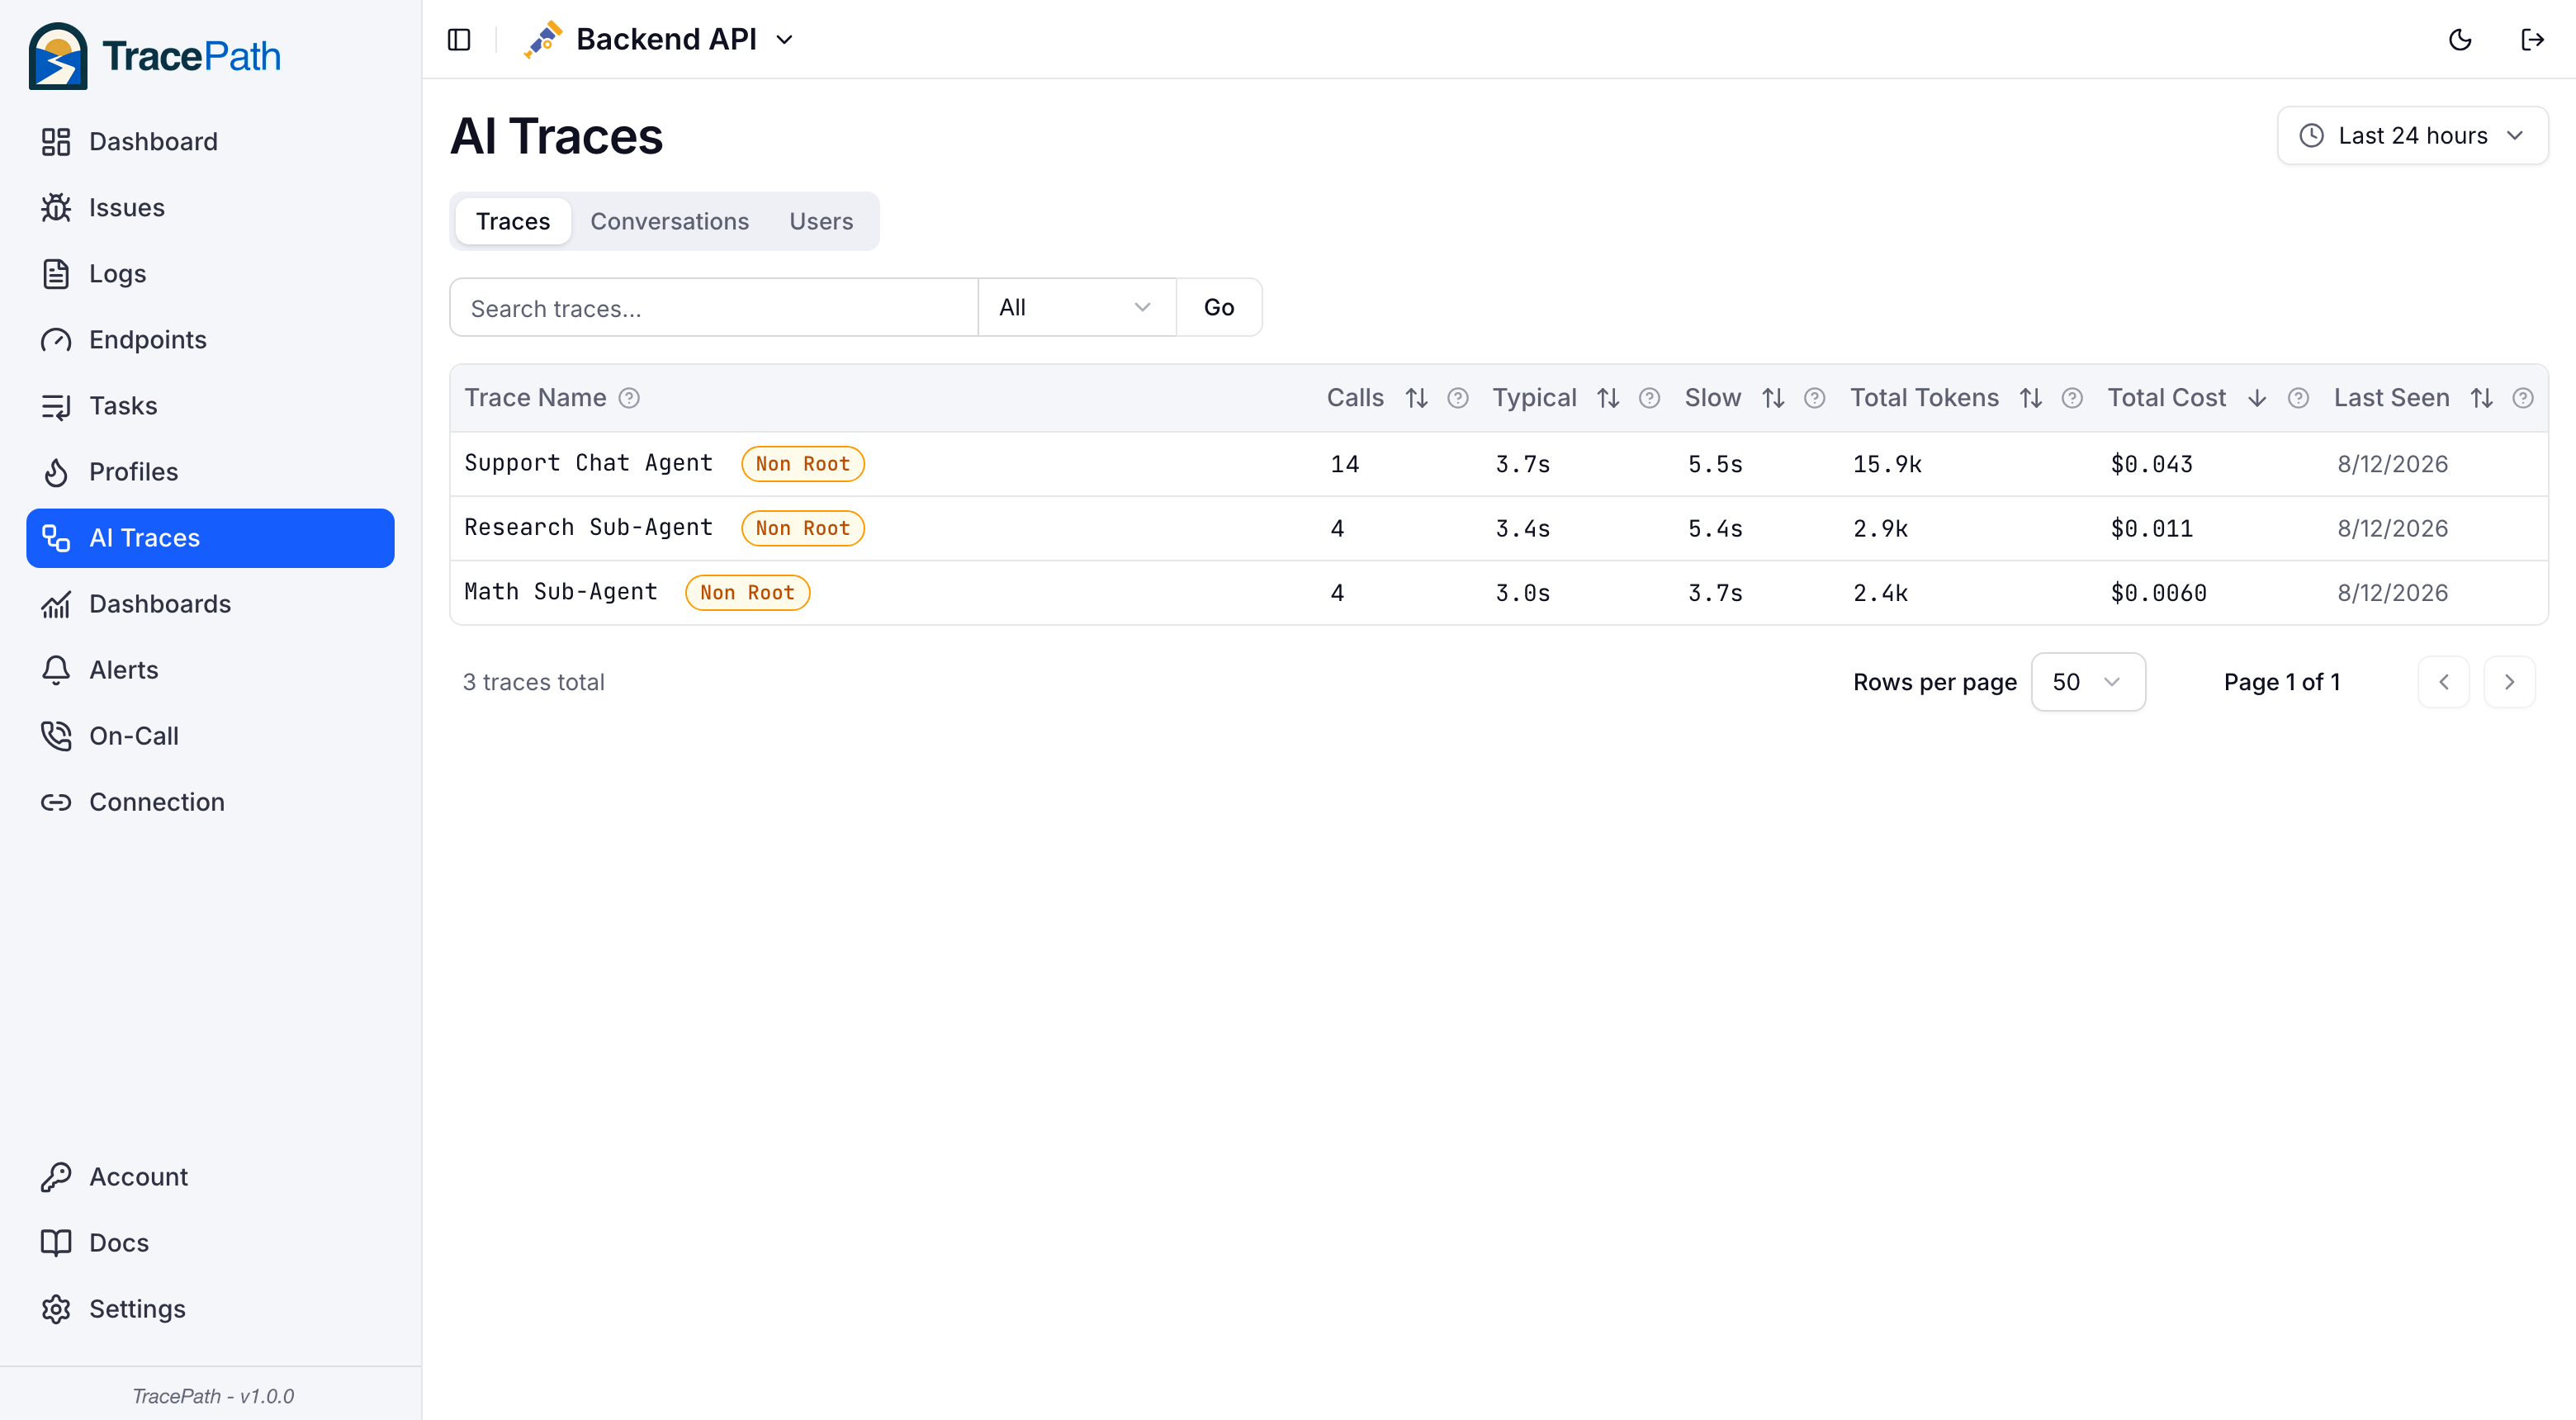
Level 1: Grouped by Trace Name
See all your AI agents/workflows at a glance with aggregate metrics: total calls, P50/P95 duration, total tokens consumed, and total cost.
Level 2: Individual Calls
Click a trace name to see every individual call: timestamp, duration, model used, tokens in/out, cost, and provider.
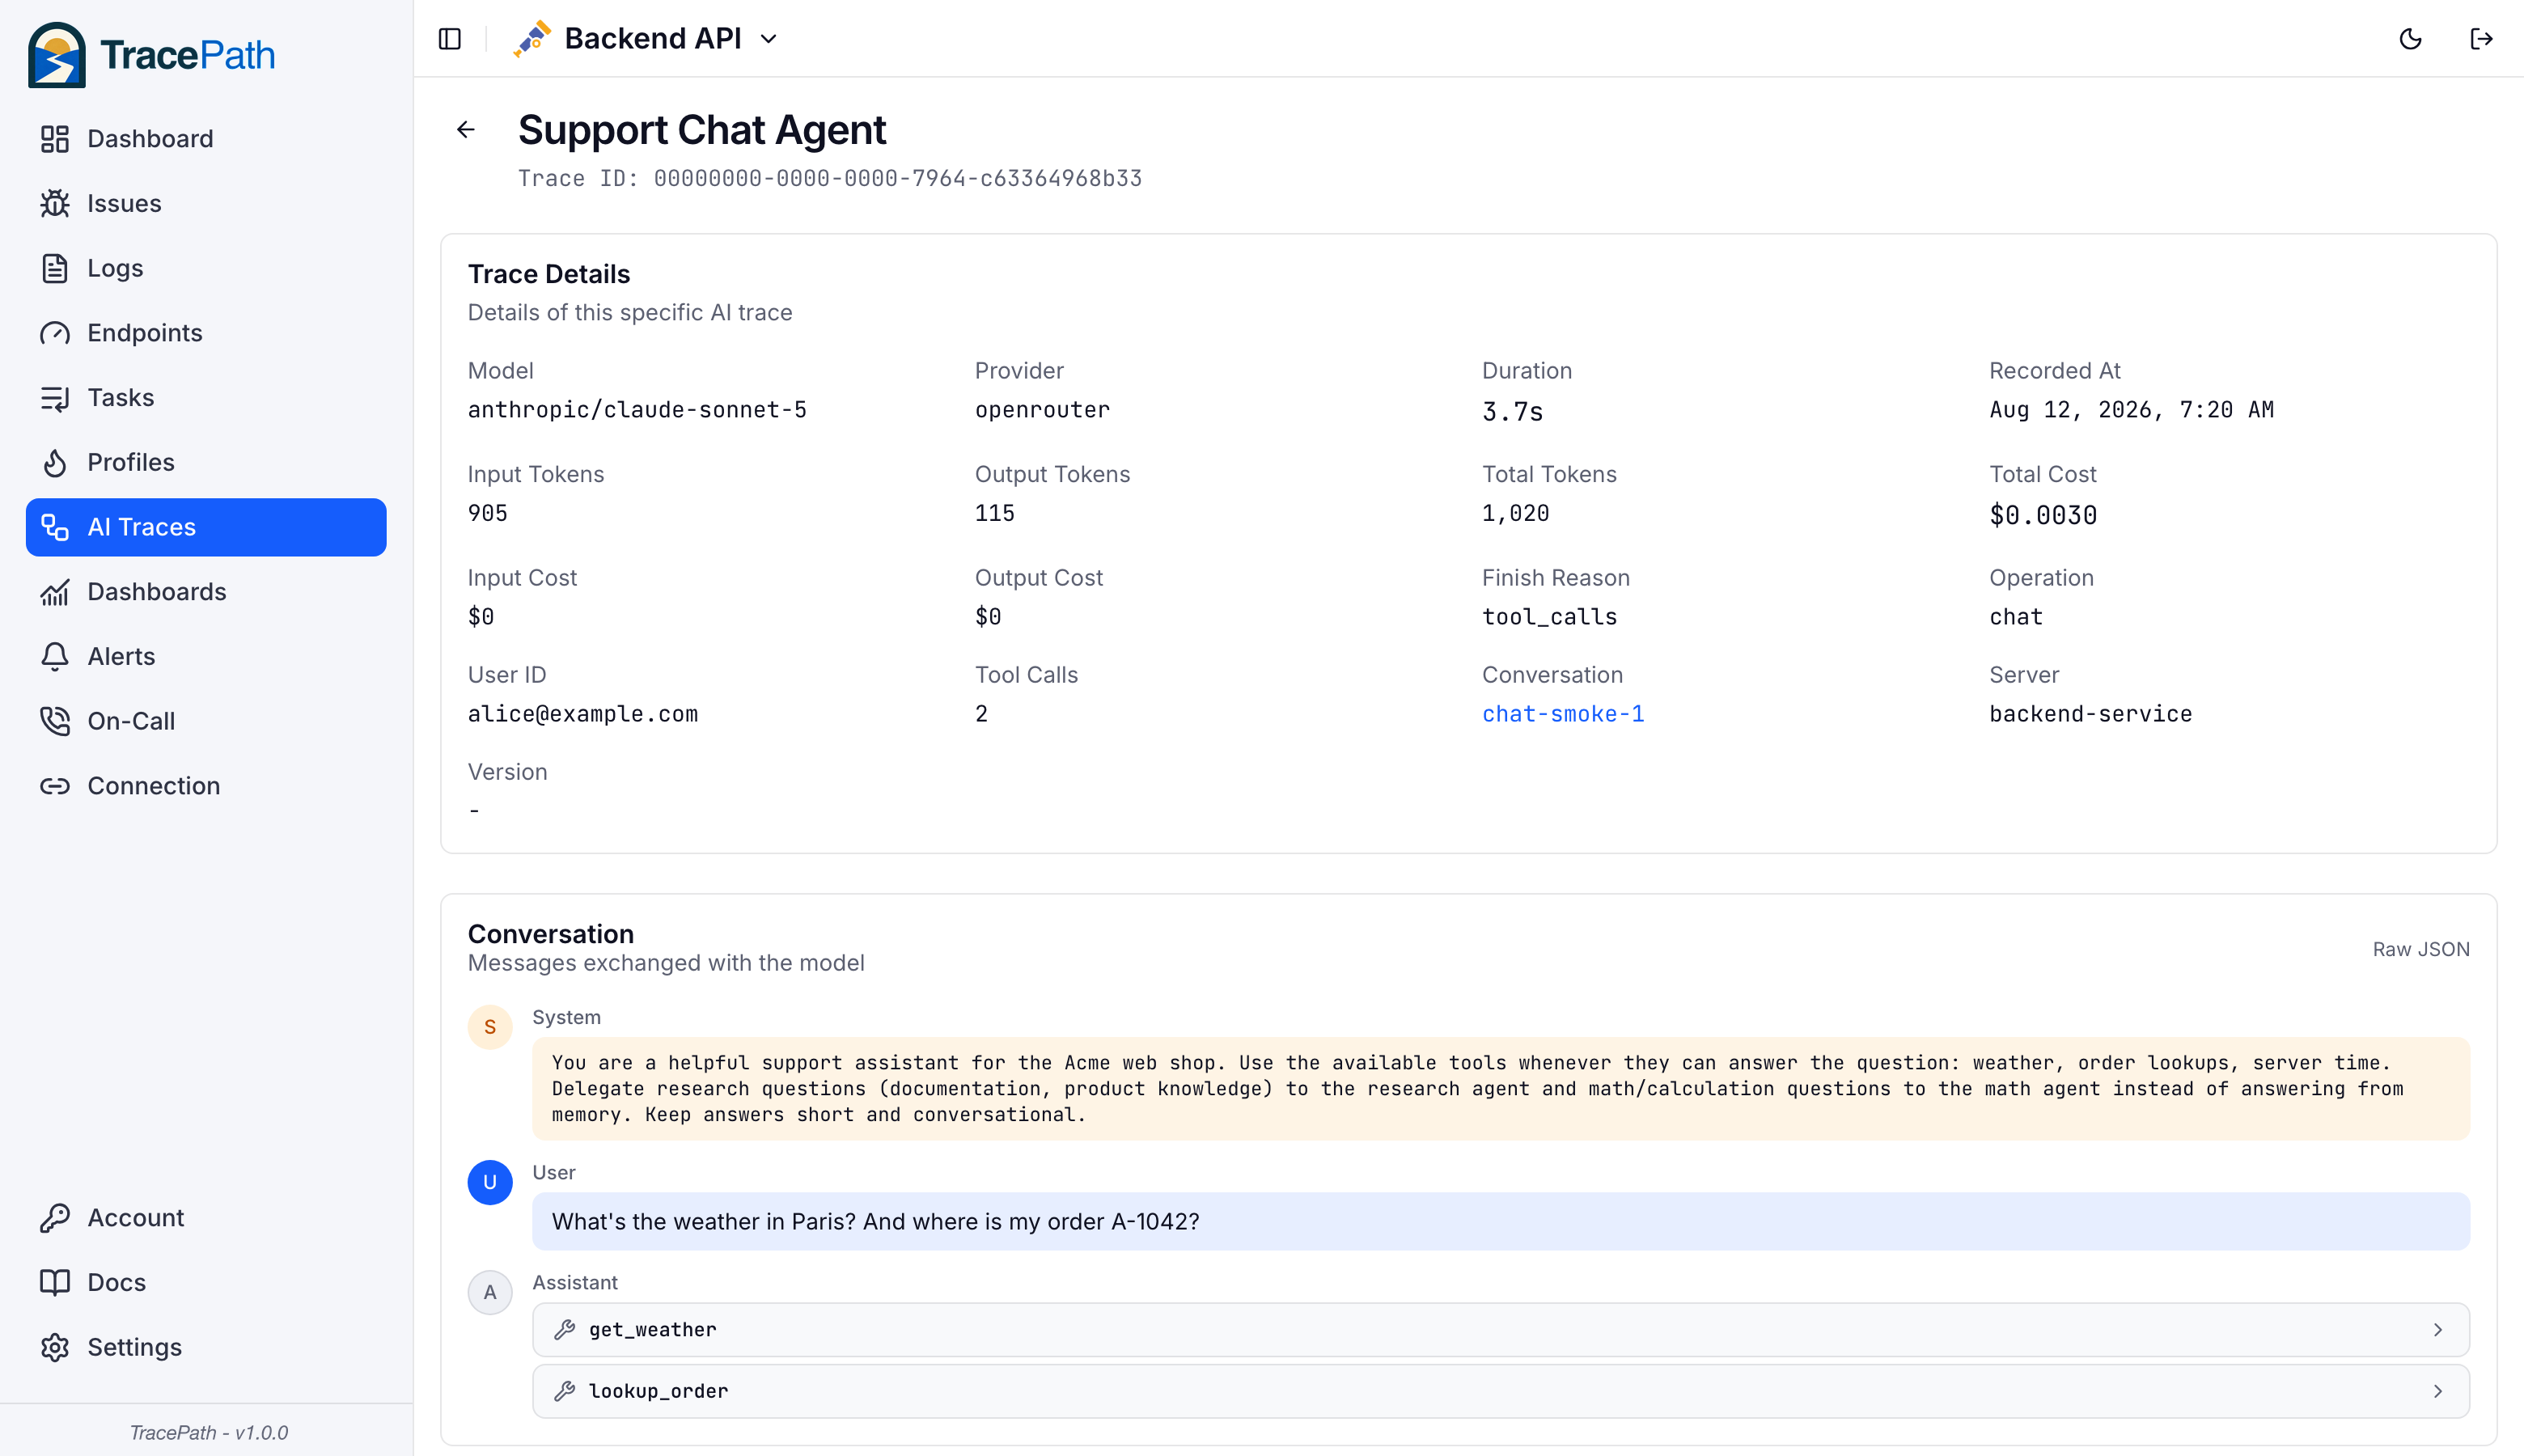
Level 3: Call Detail
Click a specific call to see the full detail: token breakdown (including cached and reasoning tokens), cost breakdown, all metadata attributes, and the complete conversation with the model rendered as a chat view.
Conversations and Users
Beyond per-call traces, TracePath rolls calls up into conversations and per-user analytics. The AI Traces page has three tabs: Traces, Conversations, and Users.
How conversations are identified
Each AI call gets a conversation id at ingest, resolved in this order:
gen_ai.conversation.idspan attribute. Set this in your app for reliable multi-turn grouping.session.idspan or resource attribute.- The distributed trace id. A single agent run inside one request still groups its calls, even without an explicit id.
Calls ingested before this feature (or with none of the above) have no conversation id and are excluded from conversation analytics.
Conversations view
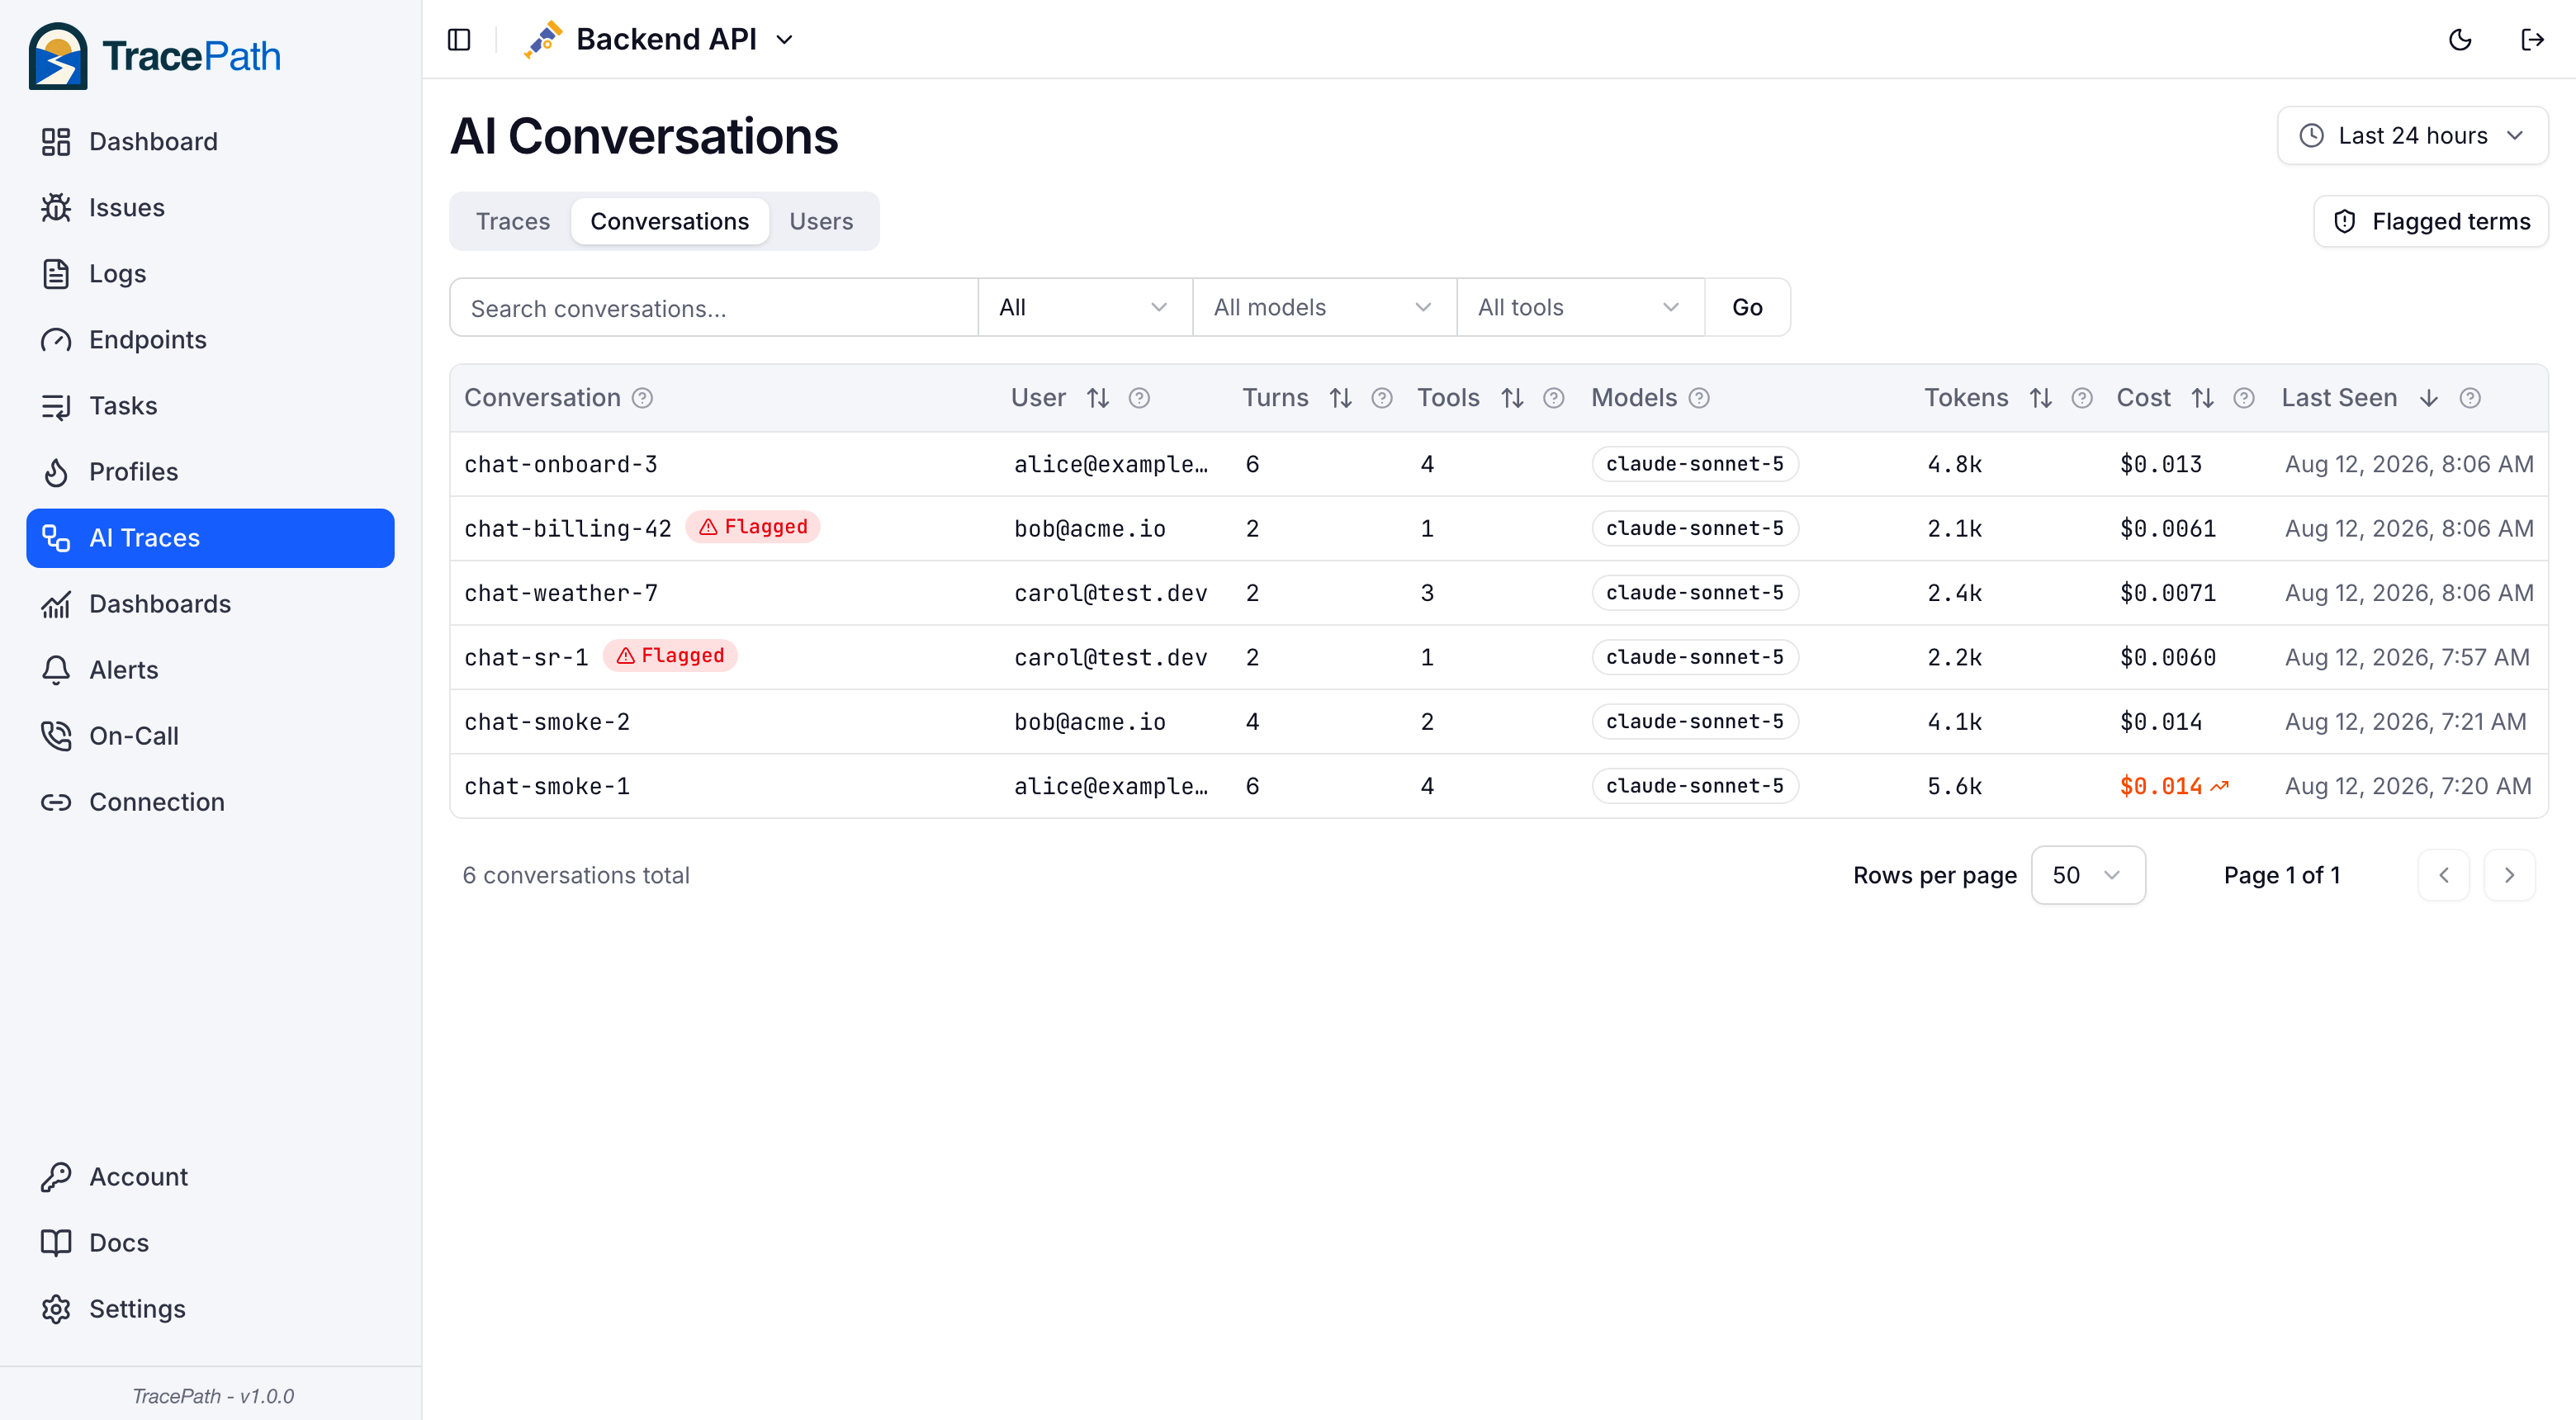
Each row is one conversation: turns (LLM call count), user, tool calls, models used, tokens, cost, and first/last seen. Conversations above the 95th percentile in cost or turns are highlighted so outliers stand out.
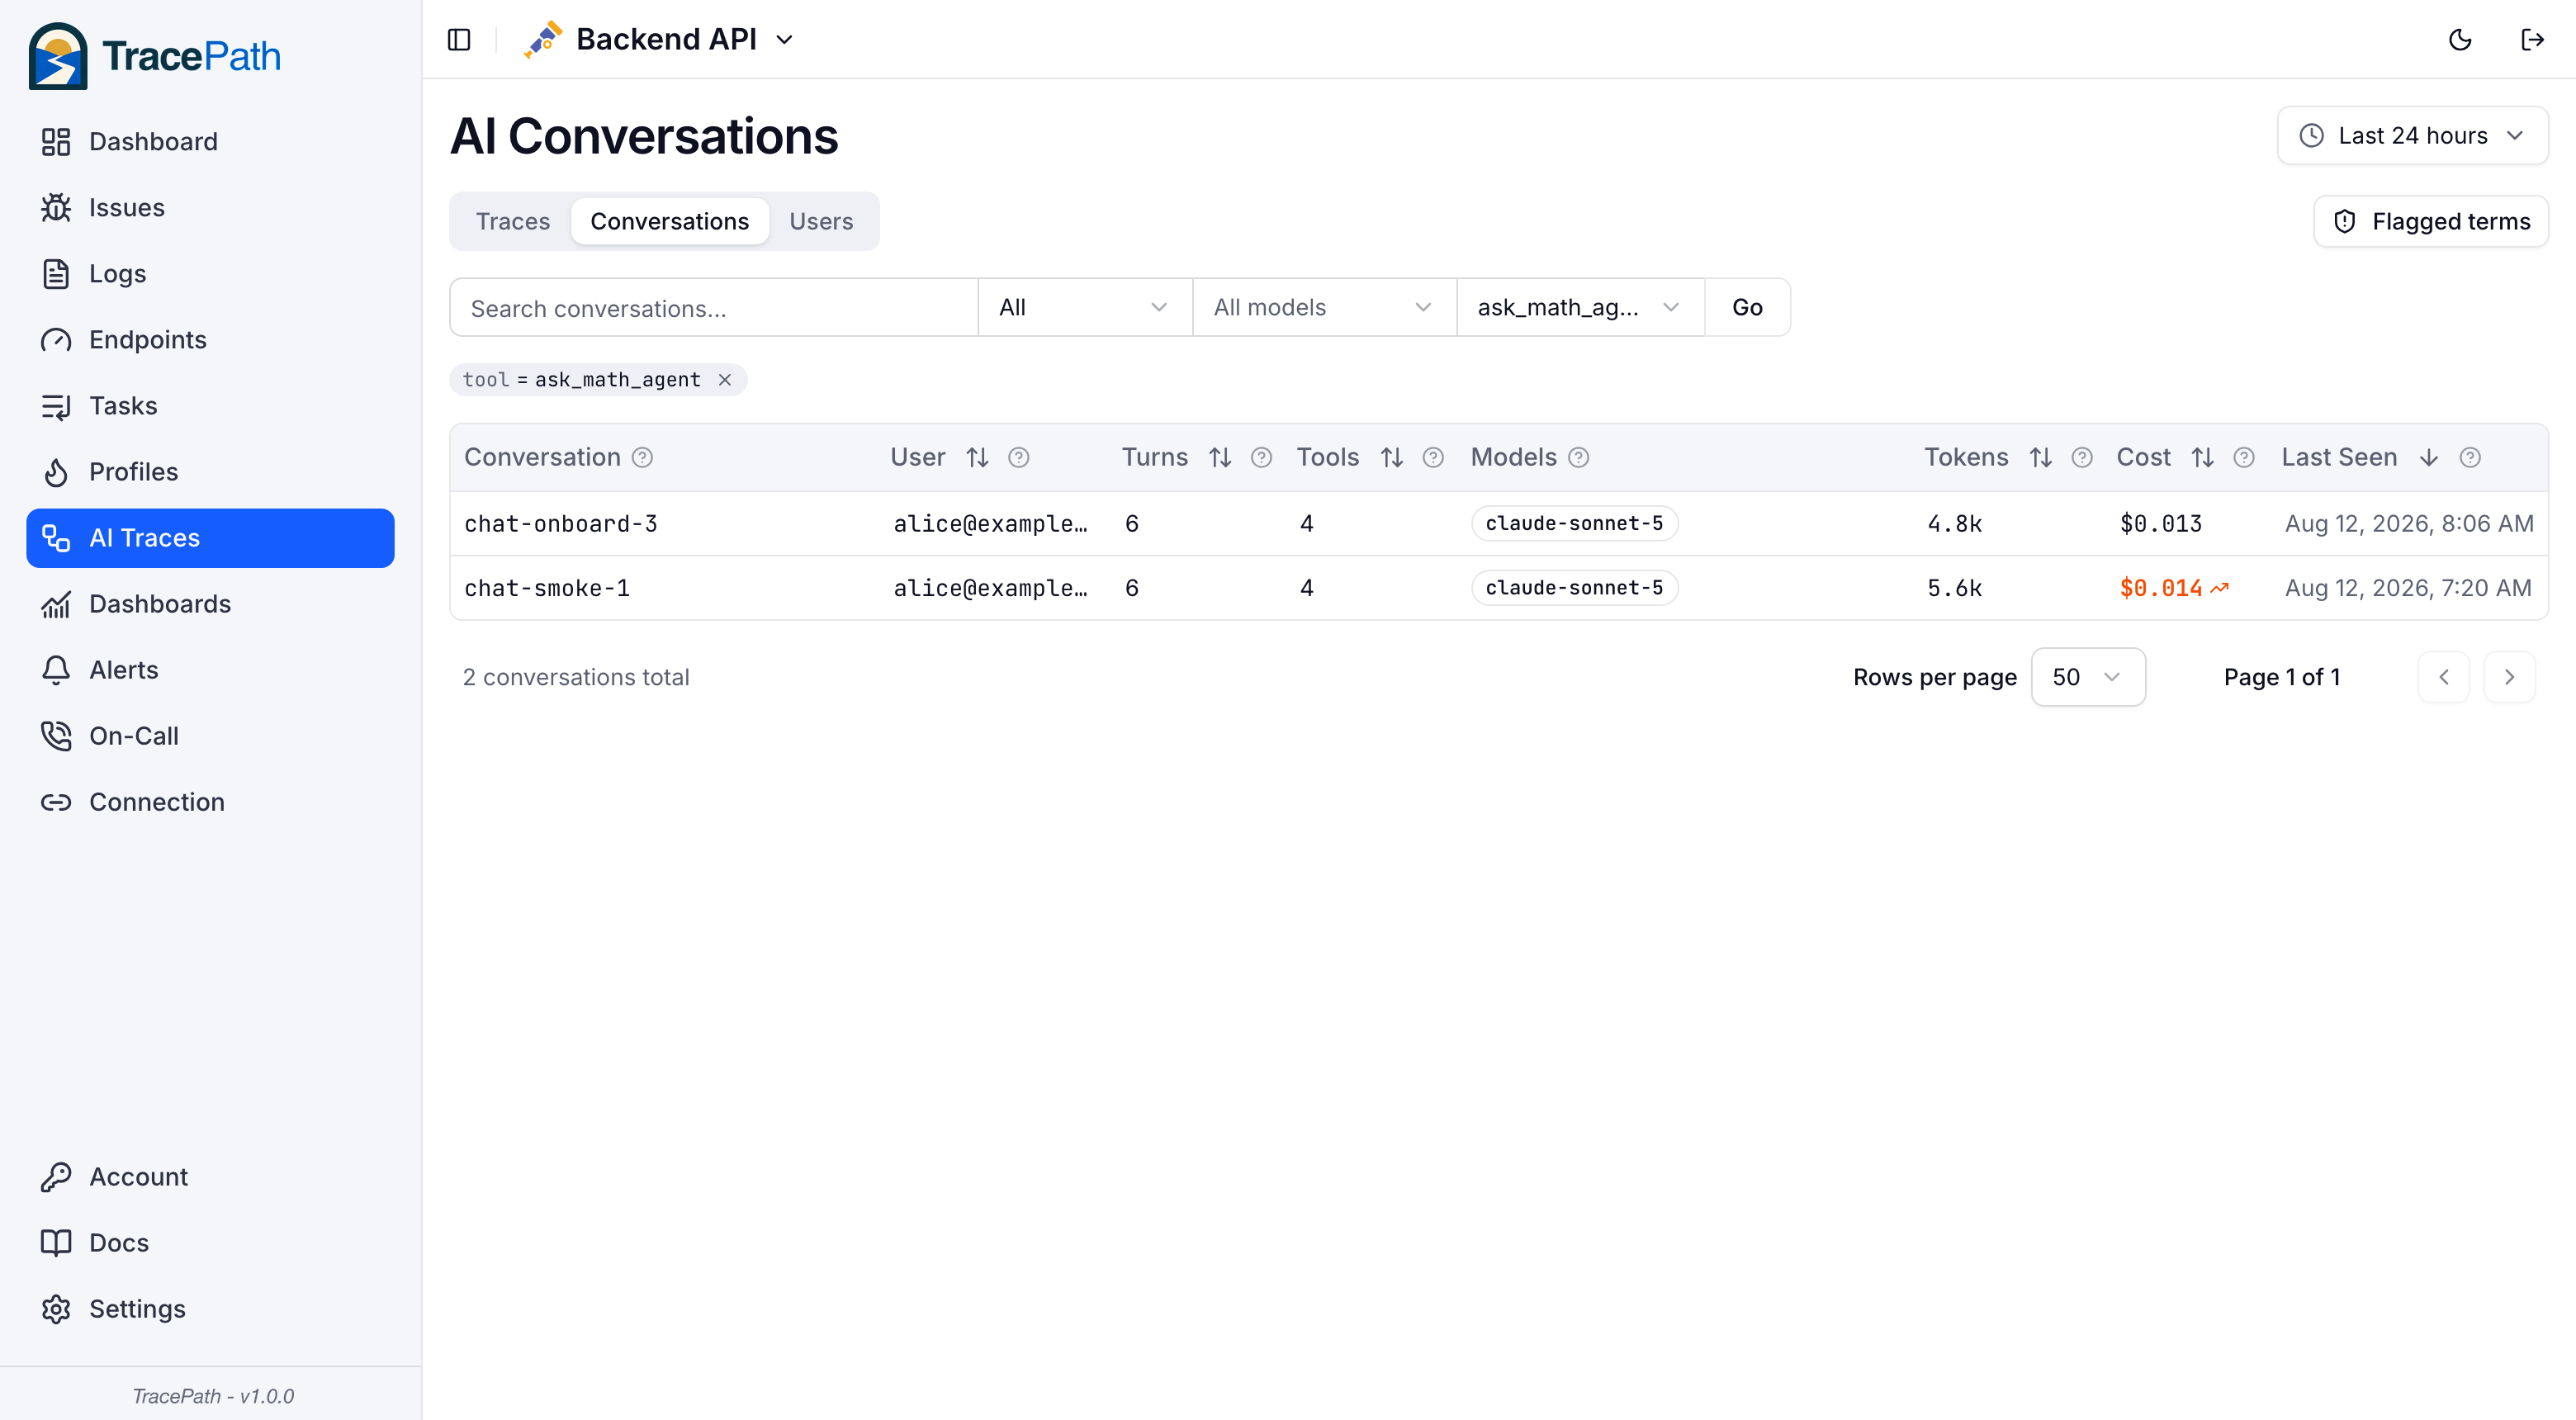
Filter by user, model, specific tool, or flagged content. Active filters show as removable pills, and free-text search matches conversation ids, users, models, tool names, and flagged terms, so searching a curse word finds the flagged conversations directly.
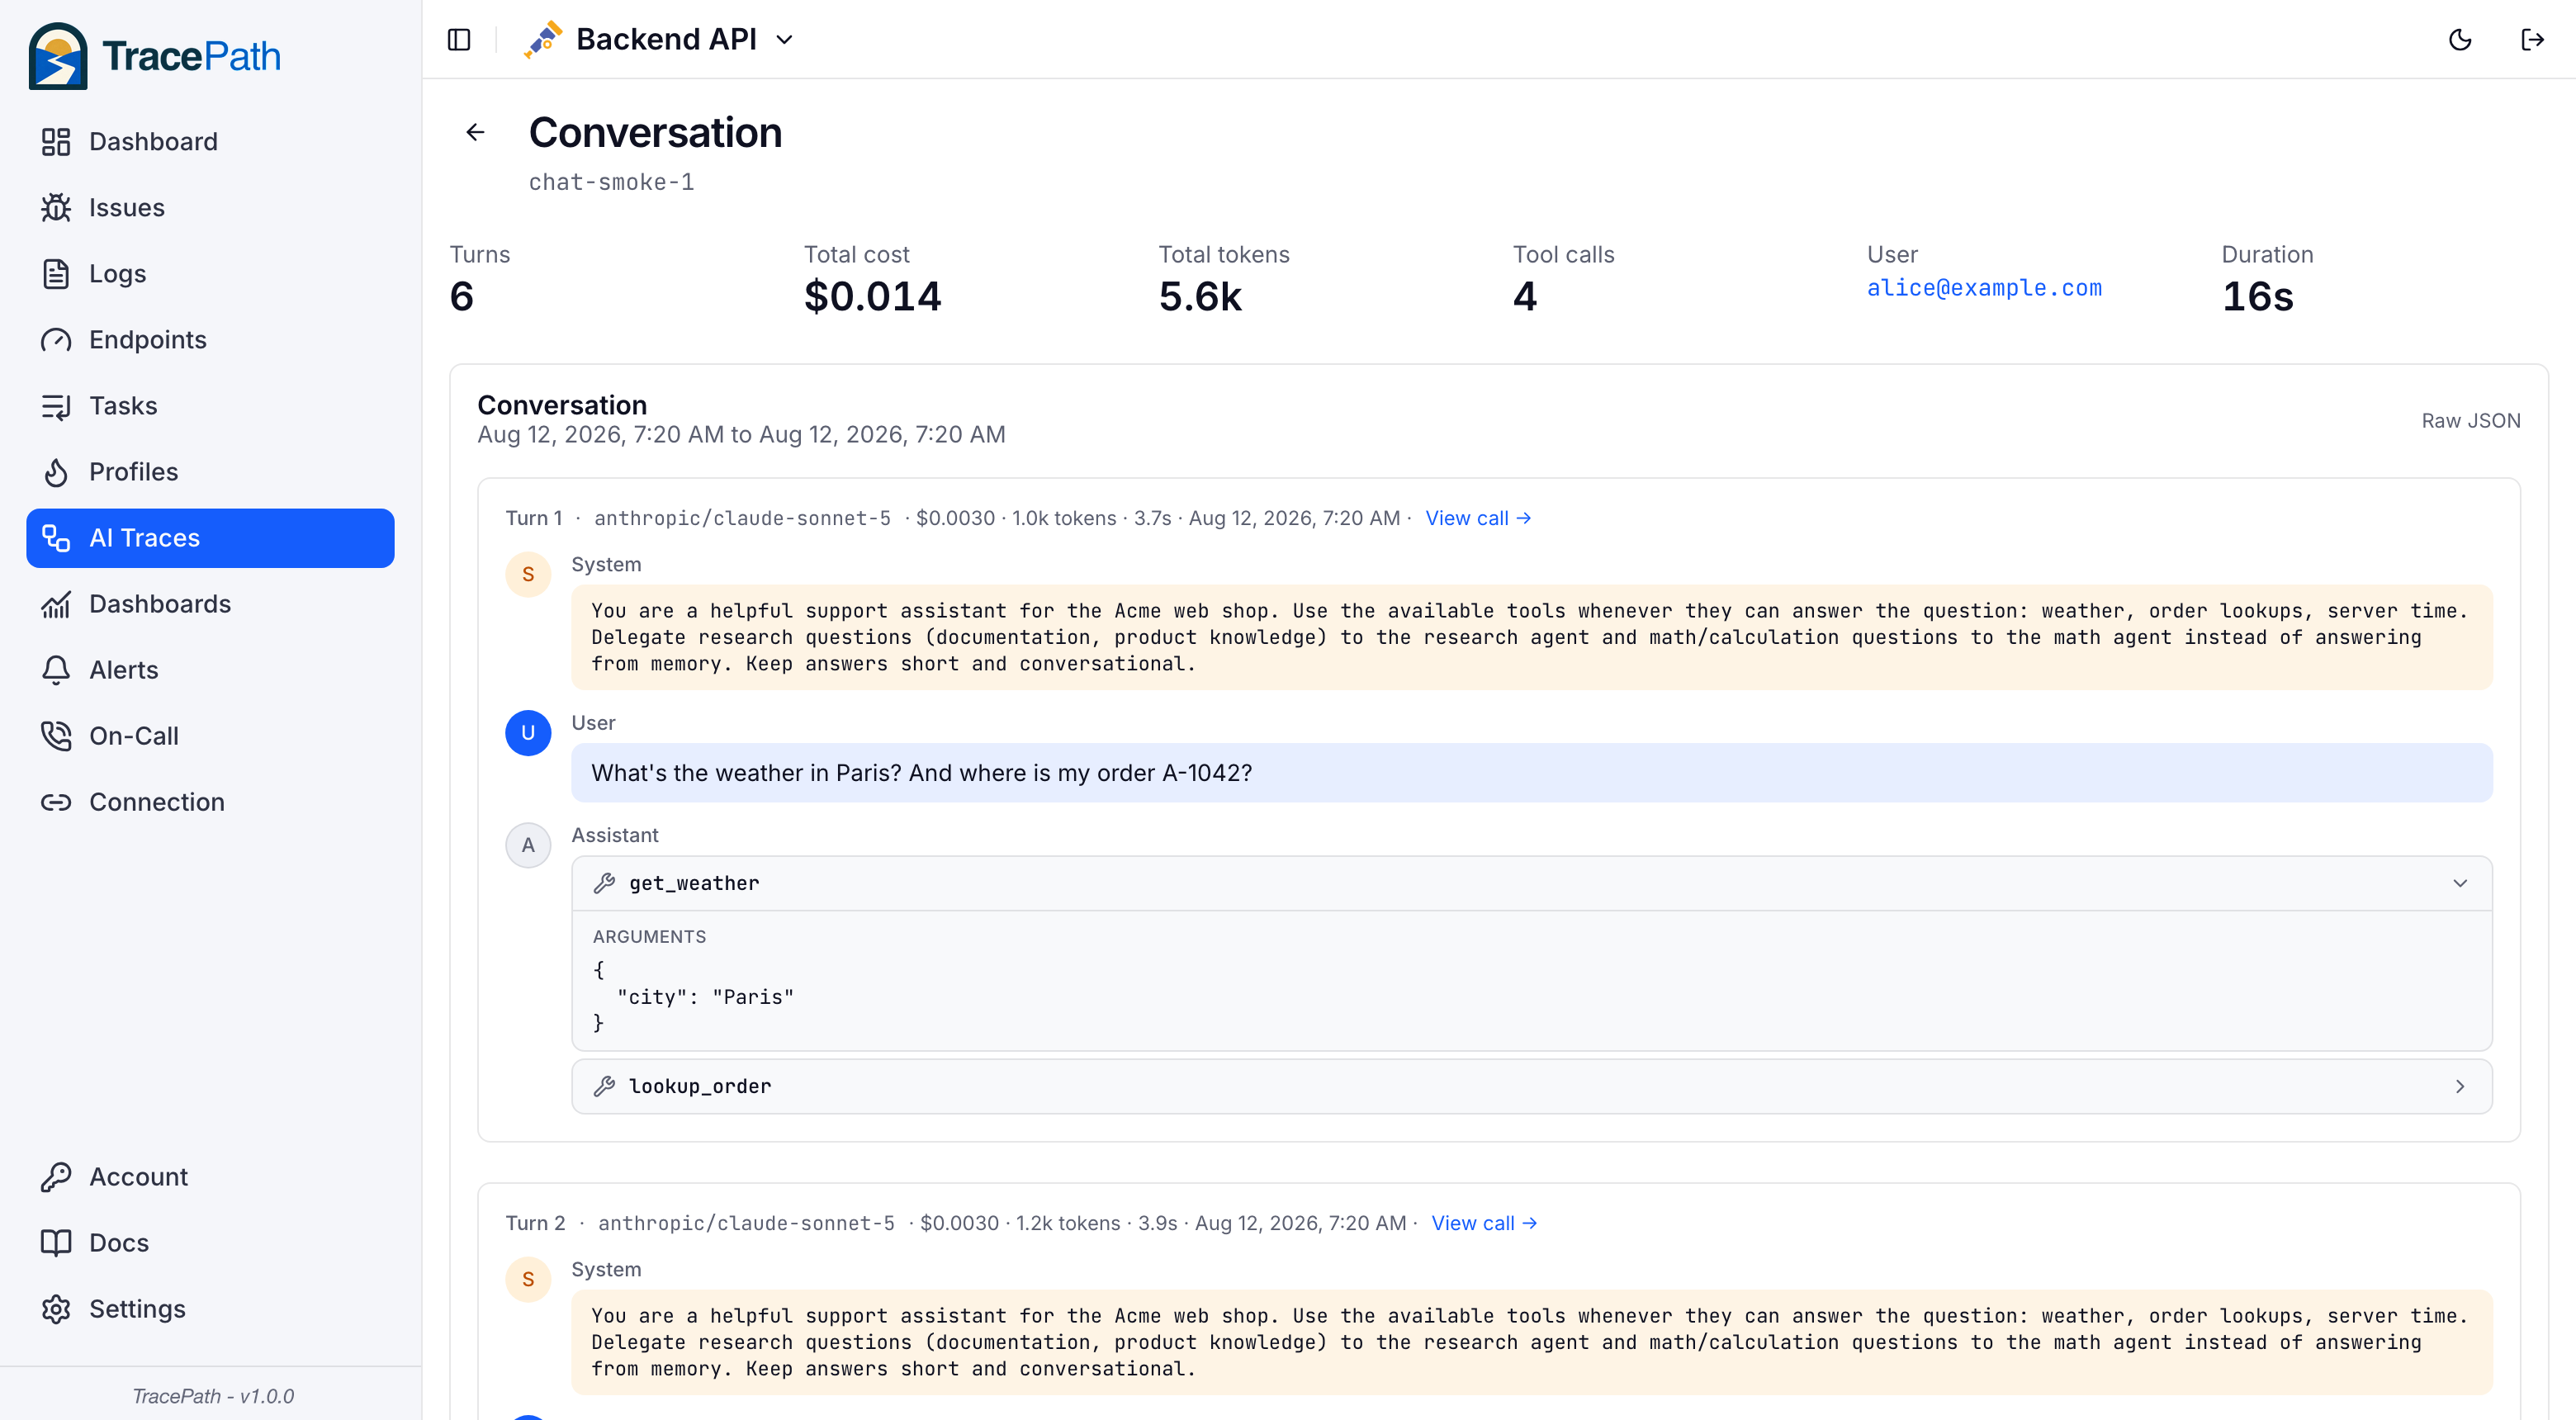
Drill into a conversation to read the full chat timeline with tool calls rendered inline (function name, arguments, and paired results), per-turn cost and tokens, and links to each underlying call.
Users view
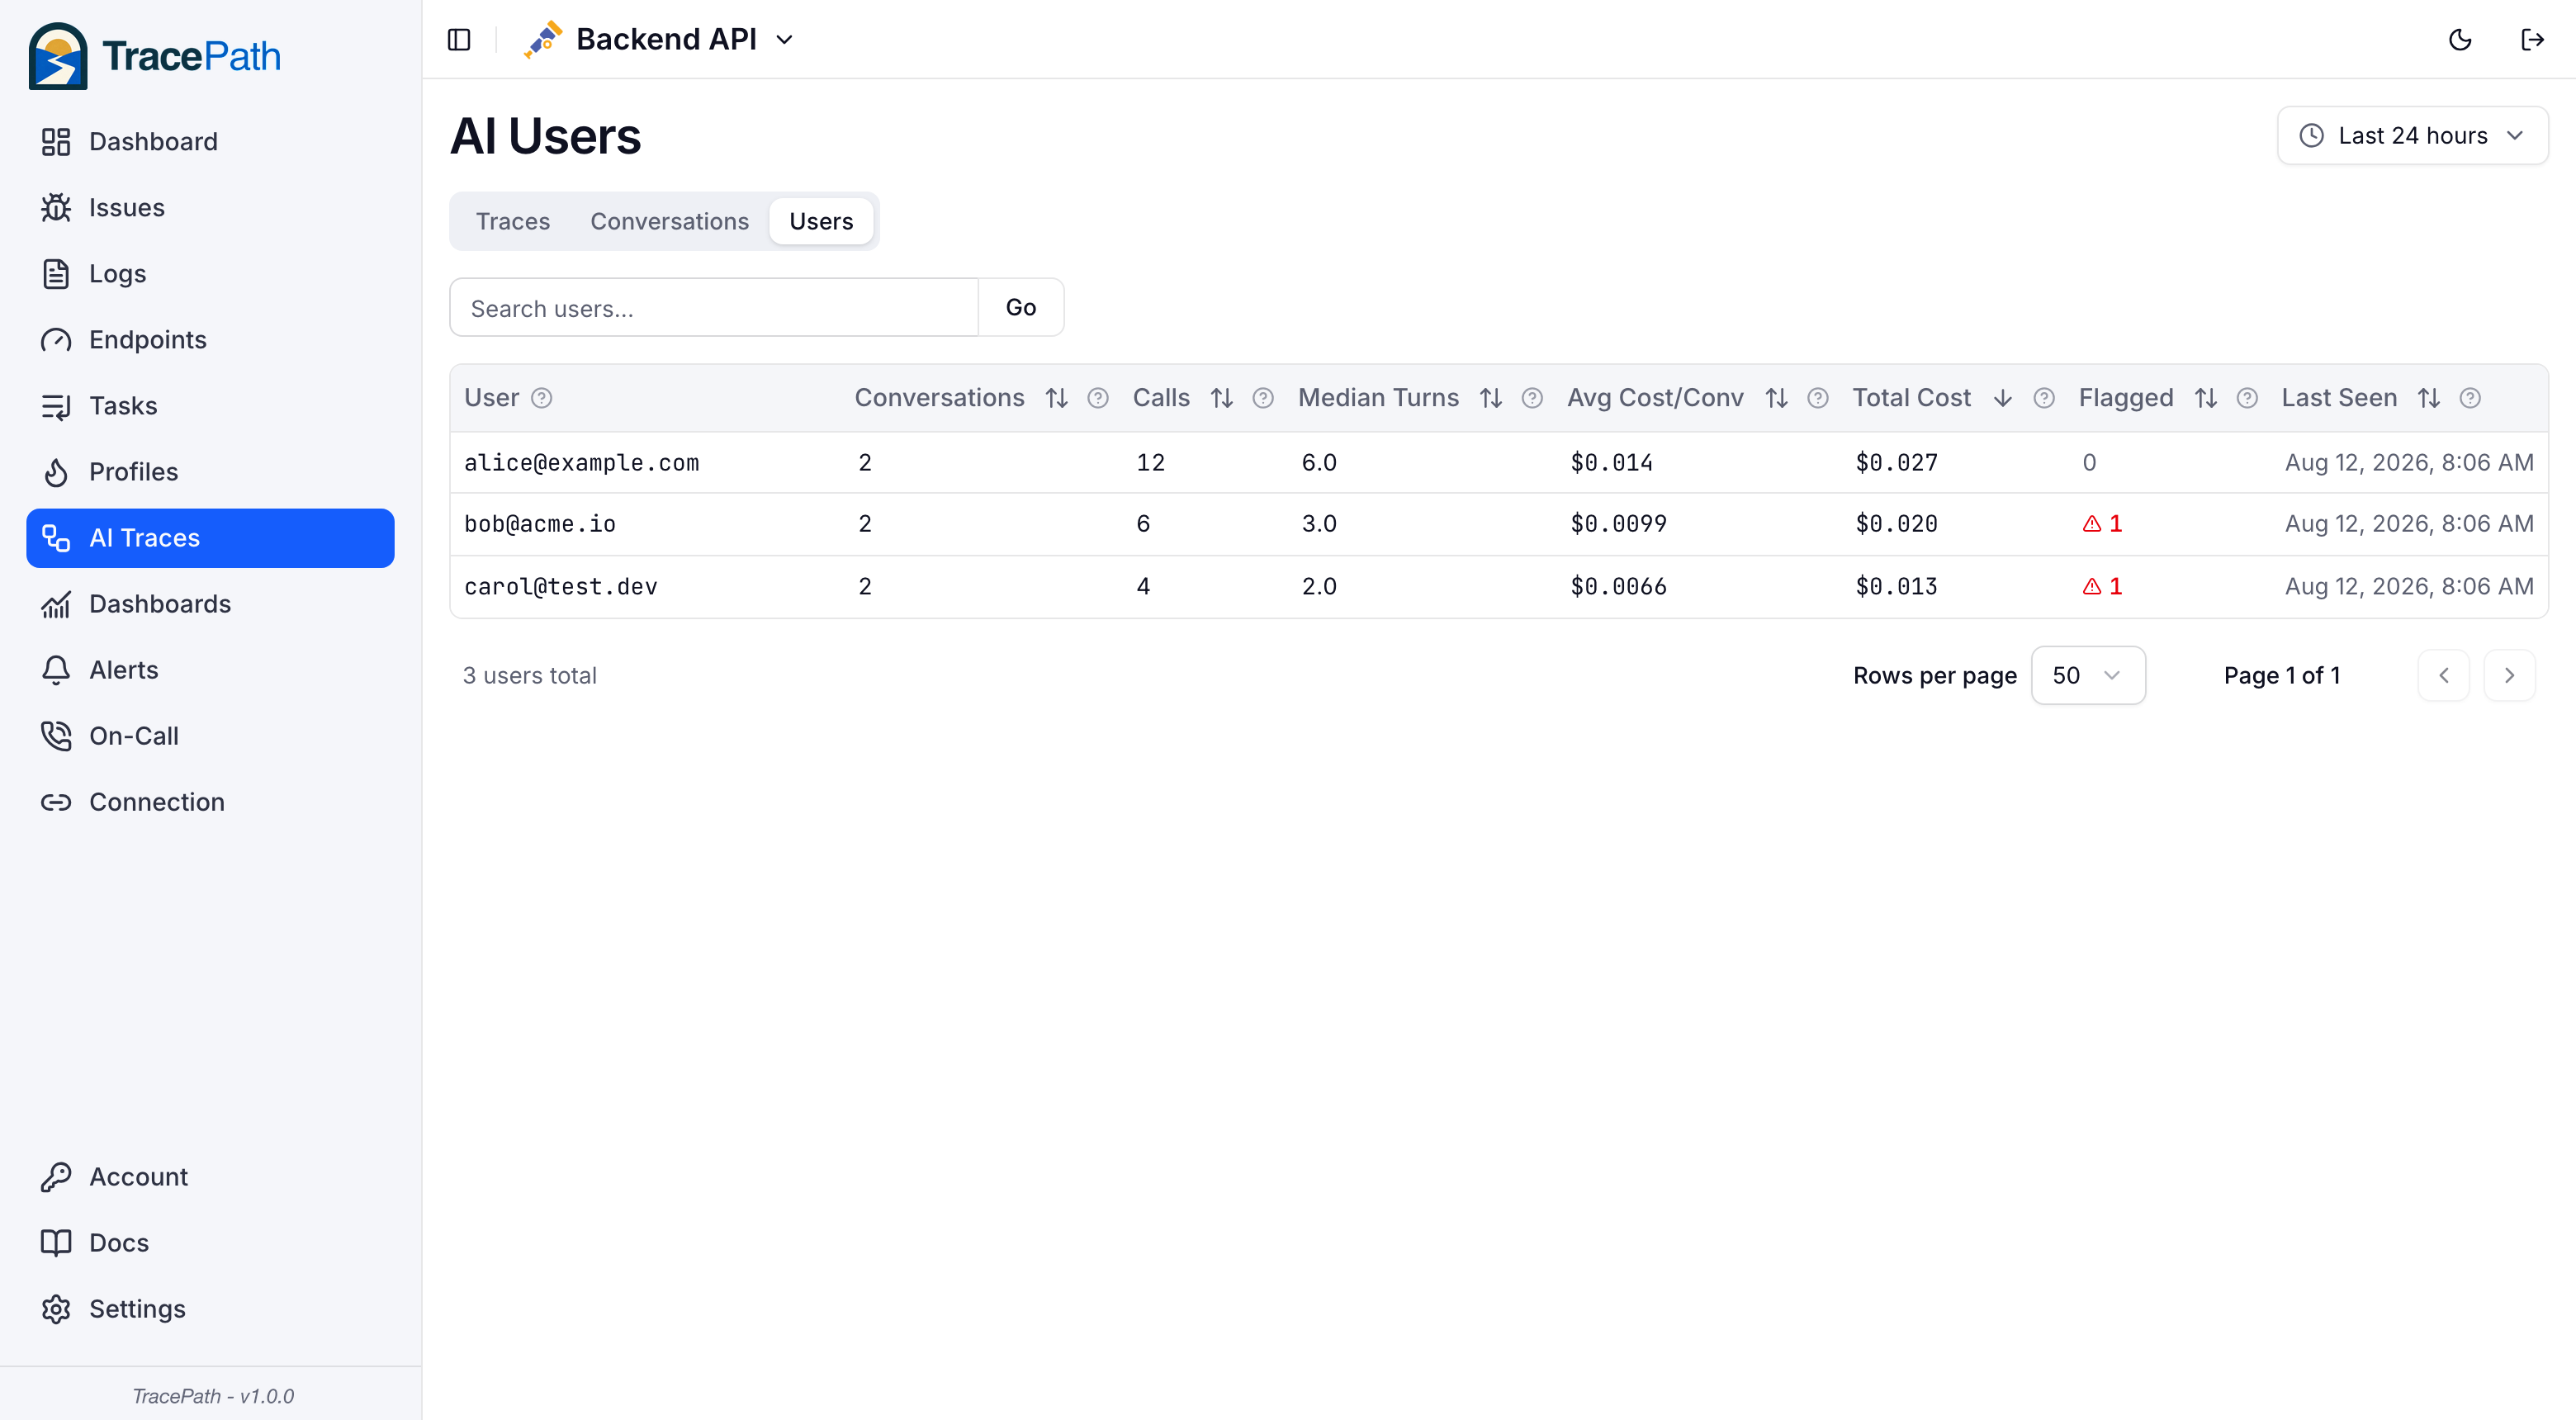
Per-customer analytics keyed on the user.id attribute: conversation count, total calls, median/average/min conversation length, average cost per conversation, total cost, and flagged conversation count. Clicking a user filters the Conversations view to them.
What to put in user.id
Set user.id on every model-call span to a stable identifier for the end user of your product, and use the same value across all of that user's sessions and conversations. Good values: your internal account/user id (best), a tenant or organization id for B2B products, or an email if emails are acceptable in your telemetry. Do not use session ids, request ids, or anything random per conversation; that is what gen_ai.conversation.id is for, and putting it in user.id makes every user look new, which destroys the per-user medians. The value is stored on every AI trace row and is searchable by anyone with project access, so if PII must stay out of telemetry, use an internal id or a hash: the analytics only need stability, not readability.
With OpenRouter's zero-code Broadcast integration, pass the user field in your chat completion requests (same guidance for the value) and it arrives as user.id. Without it, calls attribute to your OpenRouter account itself and every customer looks like one user.
Content flagging
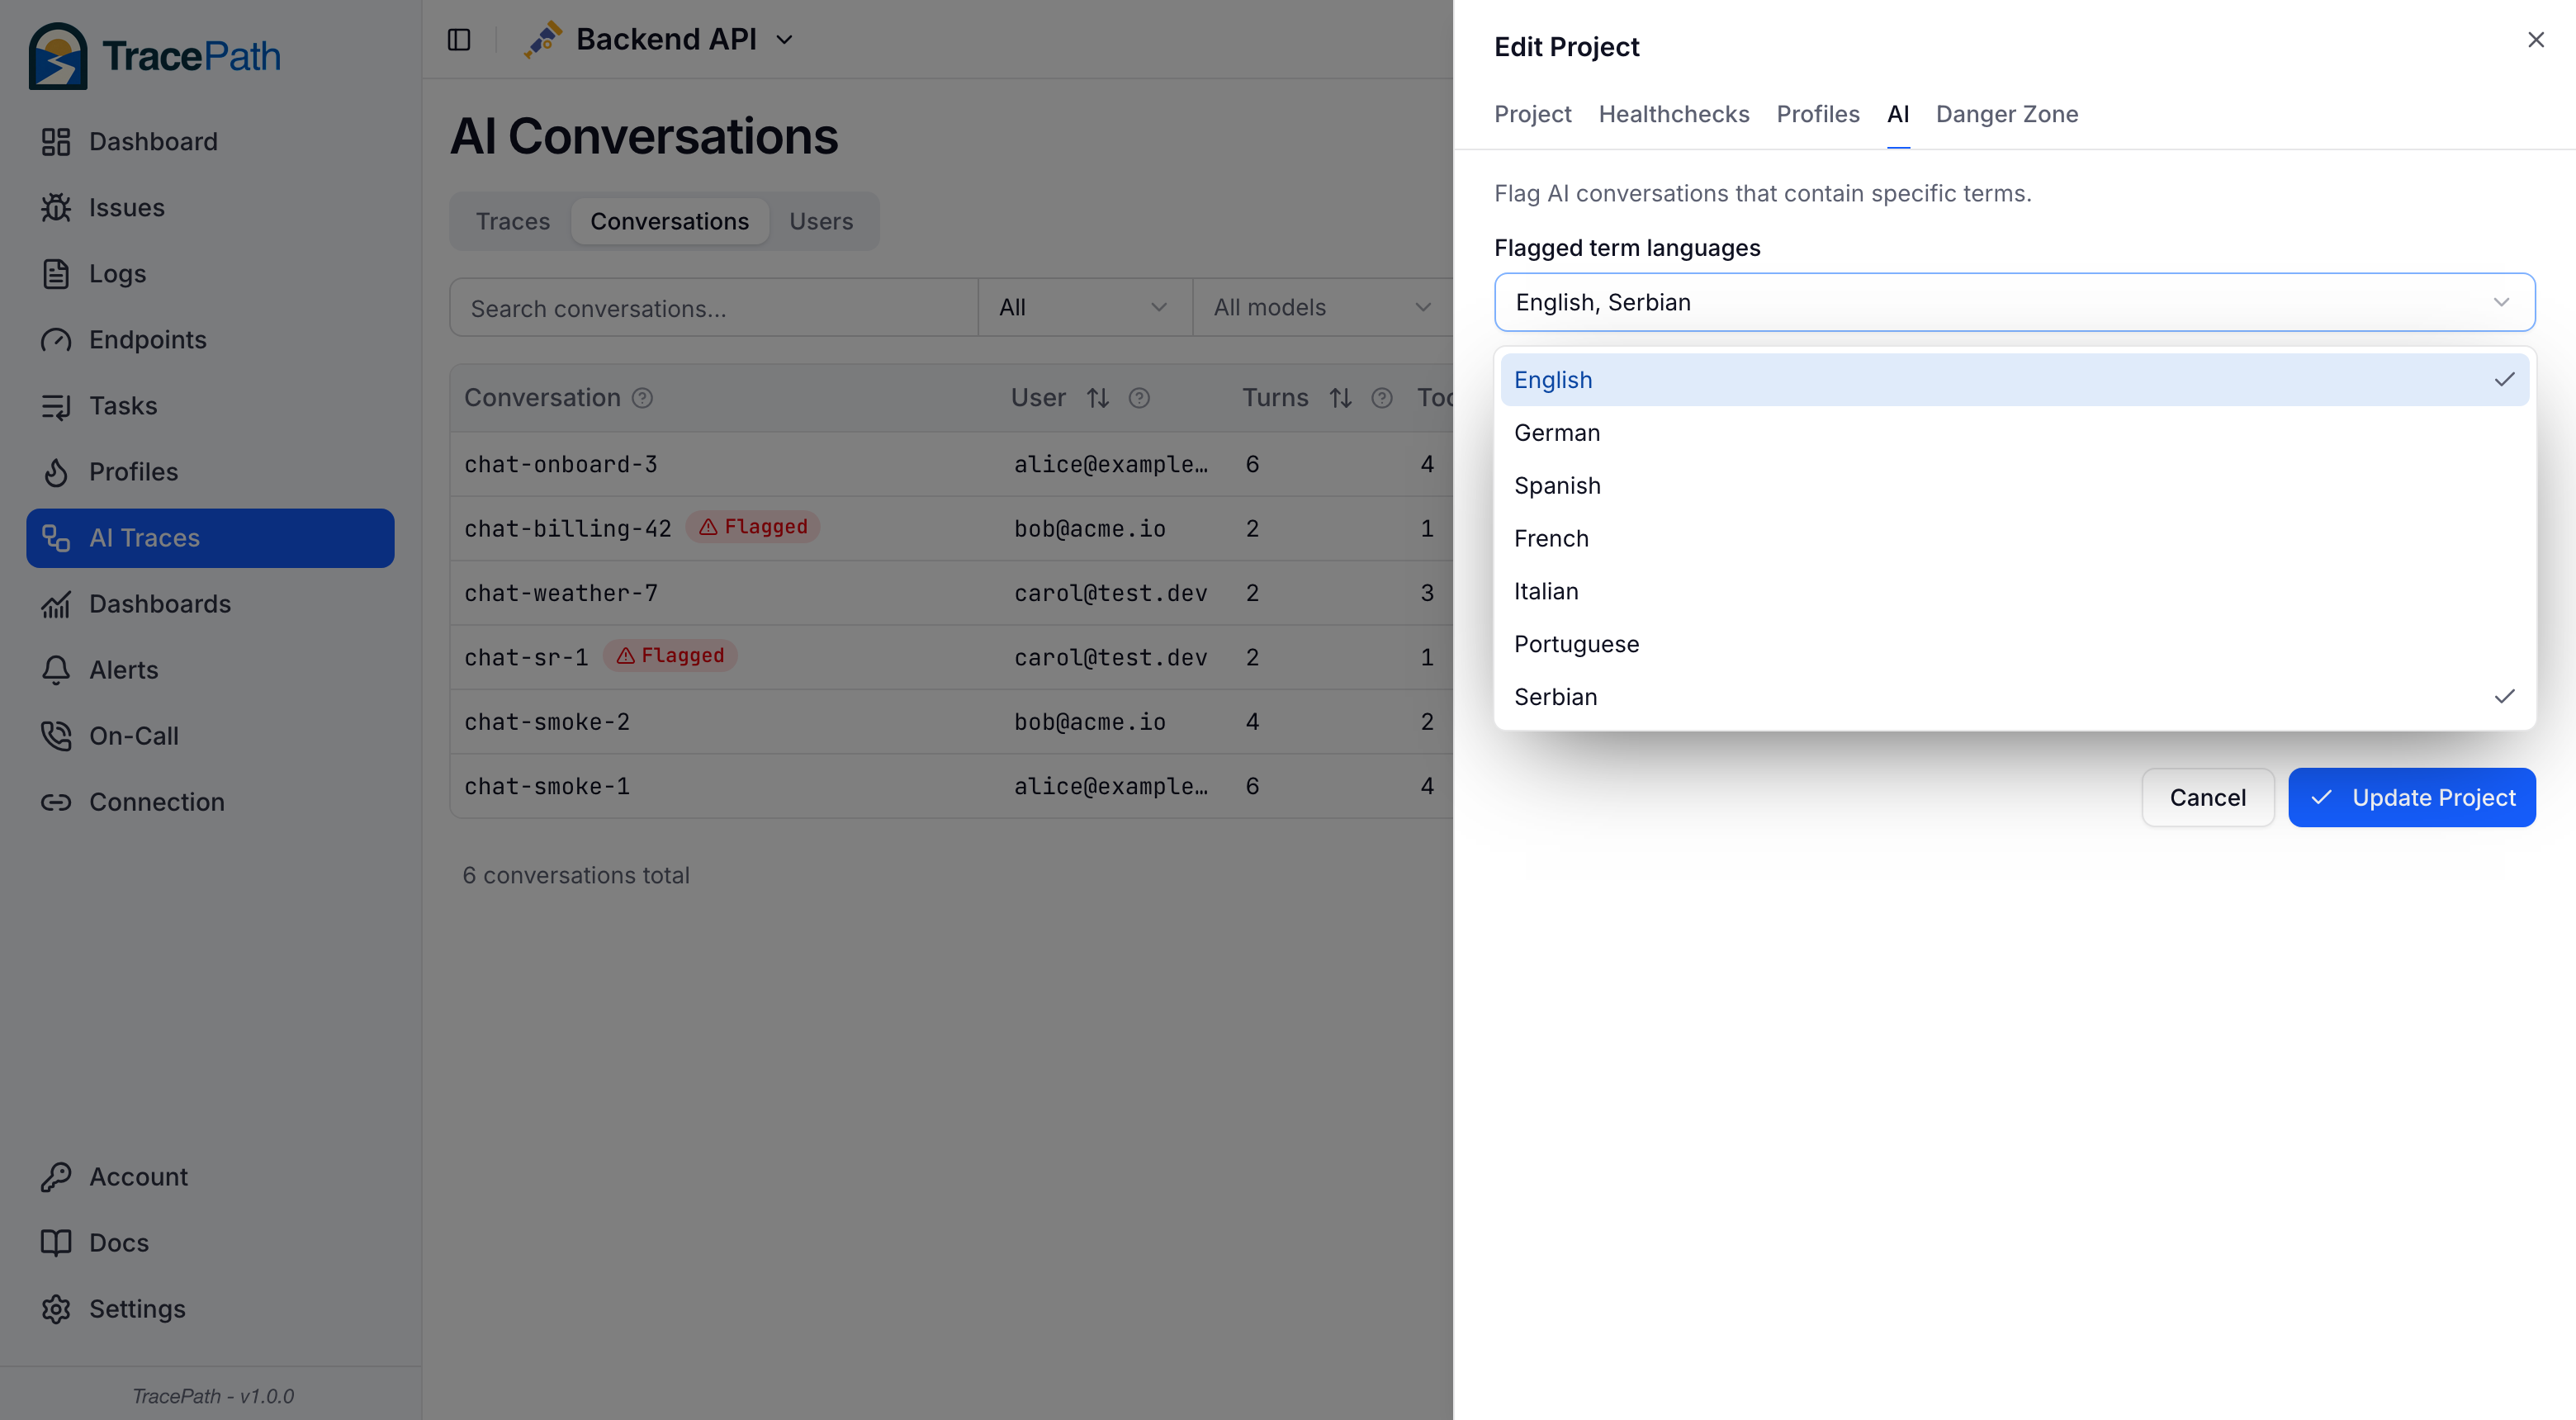
At ingest, the prompt and completion text are scanned against built-in profanity language packs plus custom terms. Packs ship for English, German, Spanish, French, Italian, Portuguese, and Serbian; enable any combination, or none to rely on custom terms only. Custom terms cover anything beyond profanity: competitor names, refund phrases, compliance keywords.
Configure both from the Flagged terms button on the Conversations page, or from the project settings sheet (Edit Project, AI tab). Changes take effect for newly ingested calls.
Matching is whole-word and case-insensitive, so terms never match inside larger words. Matched terms are indexed on the call at ingestion time only; there is no query-time scanning. They show as a Flagged badge, power the flagged-only filter, and are covered by free-text search, so searching a flagged word finds the conversations containing it. Flagging only applies to calls ingested after the configuration changes; historical calls are not re-scanned. Because matching is word-boundary based, packs are only feasible for languages with space-separated words (no CJK).
Alerting on outliers
Three notification rule types cover AI spend and content:
| Rule type | Fires when |
|---|---|
| AI Trace Cost | A single call exceeds a cost threshold |
| AI Conversation Cost | A conversation's cumulative cost over the last 24 hours exceeds a threshold |
| AI Flagged Content | A conversation matches flagged terms (optionally narrowed to specific terms) |
Conversation Storage
Conversation content (prompts and completions) can be large. A single prompt with RAG context might be 50KB+. To keep the database fast for aggregation queries, TracePath stores conversation content in object storage and reads it on demand when you view a specific trace.
This means:
- List views are fast: no large text fields in aggregation queries
- Detail views load conversations: the full input/output is fetched from storage when you drill into a specific call
- You decide what leaves your app: prompts and completions are only stored because your exporter sent them. If some of your traffic must never be readable in TracePath, drop or redact the content attributes at the source — in your OpenTelemetry processor, or in the provider's own observability settings — and the call is still traced, costed and counted without the text.
Conversation content is covered by the same retention window as the rest of your telemetry; see Billing for the per-plan figure.
Supported Providers
Any AI provider or gateway that exports OTLP traces with gen_ai.* semantic convention attributes works with TracePath. Currently tested:
| Provider | Integration |
|---|---|
| OpenRouter | Native OTLP export via Observability settings |
| Any OpenTelemetry-instrumented app | Via gen_ai.* semantic conventions |
Getting Started
See the OpenRouter integration guide for a step-by-step setup, or the OpenTelemetry guide if you're instrumenting your own AI calls.