Traces
A trace is the lifeline of one logical operation as it moves through your system: a request, a queued job, a scheduled command, an LLM call. TracePath models traces the same way OpenTelemetry does: a tree of spans identified by a shared trace id.
Spans are the primitive
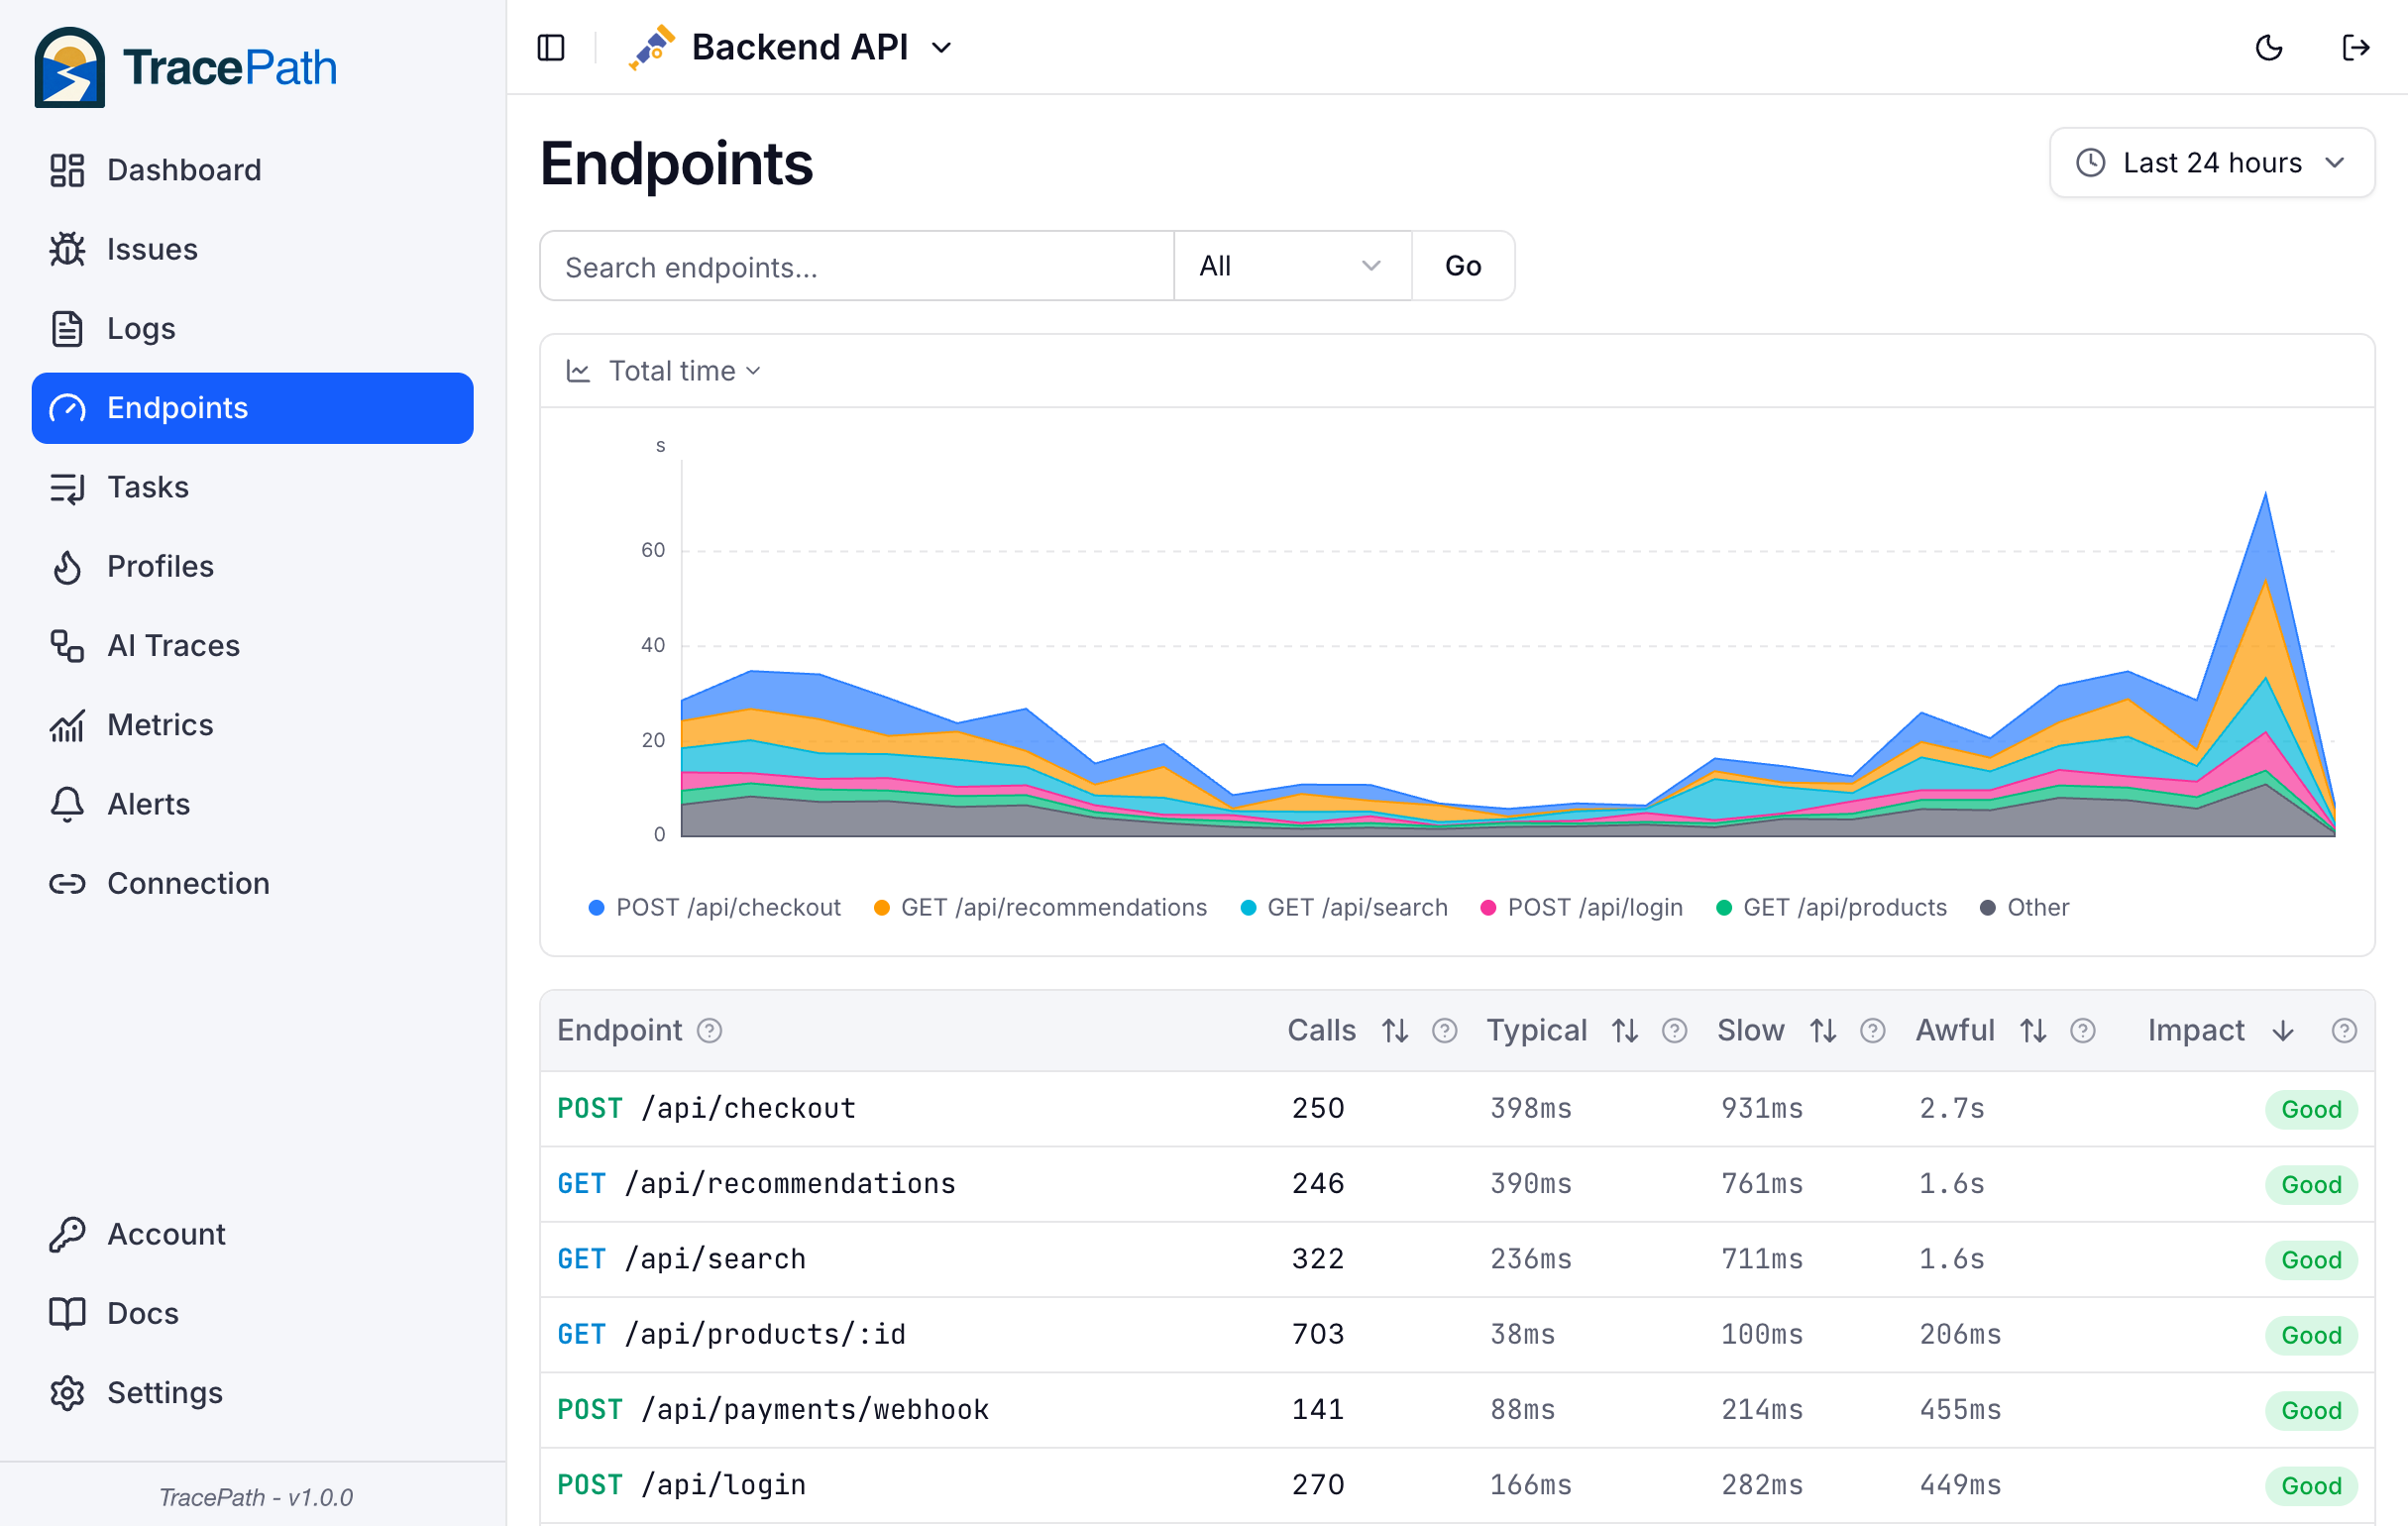
Spans are the ground truth. Every other concept in TracePath (Endpoints, Tasks, AI Traces, Issues) is derived from spans on ingestion, then stored in a dedicated table so the dashboard can answer "what's slow?" or "what's expensive?" in milliseconds without scanning every span.
OTLP span batch
    │
    ▼
┌───────────────────────────┐
│ classify by kind + attrs  │     ← promotion rules
└───────────────────────────┘
    │
    ├──► endpoints      ─┐
    ├──► tasks          ─┤  ←─ materialized views,
    ├──► ai_traces      ─┤      indexed for fast aggregation
    ├──► exception_…    ─┘
    │
    └──► spans (everything else, the raw waterfall)
You can think of endpoints, tasks, and ai_traces as cached projections of the spans table. They exist for one reason: aggregations like "P95 of every endpoint over 7 days" or "total LLM cost grouped by trace_name" need to be cheap. Scanning the full spans table to compute those every dashboard load would not be cheap.
The trade-off this design makes:
- Top-level dashboards (Endpoints, Tasks, AI Traces) are fast: they read a small, pre-aggregated table.
- The detail/waterfall view falls back to
spansfor the full timeline of children under any entity. - Promotion happens at write time, not at query time, so the rules are baked in once per span.
What gets promoted
A span lands in a top-level table when its kind or attributes match a rule. The classifier doesn't care whether the span is a root or a child. It cares about what the span represents.
| Condition on the OTel span | Promoted to |
|---|---|
SpanKind = SERVER / INTERNAL + HTTP attributes, and the span is an inbound entry point (root, or parent lives in a different process) | Endpoint |
SpanKind = CONSUMER (queue / messenger workers, root or child) | Task |
Root INTERNAL span with a console.command attribute (artisan / artisan-style runners) | Task |
Any span carrying gen_ai.* attributes (root or child) | AI Trace |
"exception" event on any span | Issue (attributed to the owning entity above) |
| Anything else with a parent | Span in the waterfall, re-rooted to its nearest enclosing entity |
In-process sub-handler spans (e.g. a framework's "handler /path" INTERNAL+HTTP child) stay in the spans table. Endpoints are only promoted for actual entry points, so frameworks don't silently double-emit.
Root and non-root entities
Each Endpoint / Task / AI Trace row carries an is_root flag.
- Root: the span had no parent in any process. This is the typical case: an inbound HTTP request, a standalone cron run, a fresh LLM call.
- Non-root: the span was triggered by another trace. Examples:
- A queue worker's CONSUMER span parented to the dispatcher's PRODUCER span via the trace context serialized into the job payload.
- A child gen_ai span made inside a request handler.
- A cross-service inbound HTTP hop where the upstream service propagated
traceparent.
Non-root rows surface a Non-root chip in the dashboard list. On the row's detail page, a View distributed trace link jumps to the full picture across all the entities sharing that trace id.
The id rules avoid collisions when a root and a non-root entity share the same trace id:
- Root entity id = OTel trace id (so the request and its lineage are easy to look up by trace id).
- Non-root entity id = the entity's own span id (distinct from the root's id even within the same trace).
Distributed traces
Every Endpoint / Task / AI Trace stores a distributed_trace_id equal to the OTel trace id, auto-derived on ingestion. So:
- A request that dispatches a queue job and the worker that processes it share the same
distributed_trace_id. They show up as two rows (the endpoint and the task), and a single page (/distributed-traces/<id>) renders them side by side with their spans. - A request handler that calls an LLM produces an endpoint row and an ai_trace row with the same
distributed_trace_id. Same cross-trace page. - Cross-service HTTP hops (each service exports its own SERVER span) all share the trace id. Each hop appears as its own endpoint row.
You don't need to set any vendor attribute for this to work, OTLP's native trace_id is enough. If you do need to stitch runs that genuinely carry different trace ids, the span attribute tracepath.distributed_trace_id overrides the derived value.
What each entity stores
The shape mirrors what's useful for the dashboard's aggregations on that entity.
Endpoints
Identified by HTTP method + route template (GET /api/users/:id). Ranked by Impact, a composite of Apdex, error rate, P99, client-error rate, and volume-weighted error rate. Streaming responses (SSE / WebSocket) are flagged and excluded from latency-based components.
Unmatched requests (404s)
Requests that return 404 without matching any route are grouped under a single UNMATCHED endpoint. This keeps scanner and bot traffic from creating one endpoint row per probed path, and UNMATCHED is excluded from client-error impact scoring.
On the OTel ingestion path, a 404 from a matched route keeps its route identity. If your GET /users/:id handler deliberately returns 404 for a missing user, it stays grouped under GET /users/:id. A request only becomes UNMATCHED when:
- the span carries no valid
http.routeattribute, meaning the framework matched no route, or http.routeis a catch-all made only of slashes and wildcards, such as/,/*,/**, or*/*. Some instrumentations report these for unmatched requests: Express reports/when only app-level middleware ran, and Spring reports/**for its static resource handler.
Scoped wildcards like GET /api/* are real routes and keep their name even on 404.
If a genuine route of yours is collapsing into UNMATCHED, the fix is in the instrumentation, not here: make sure the framework's OpenTelemetry integration sets http.route to the route template rather than the raw path.
Tasks
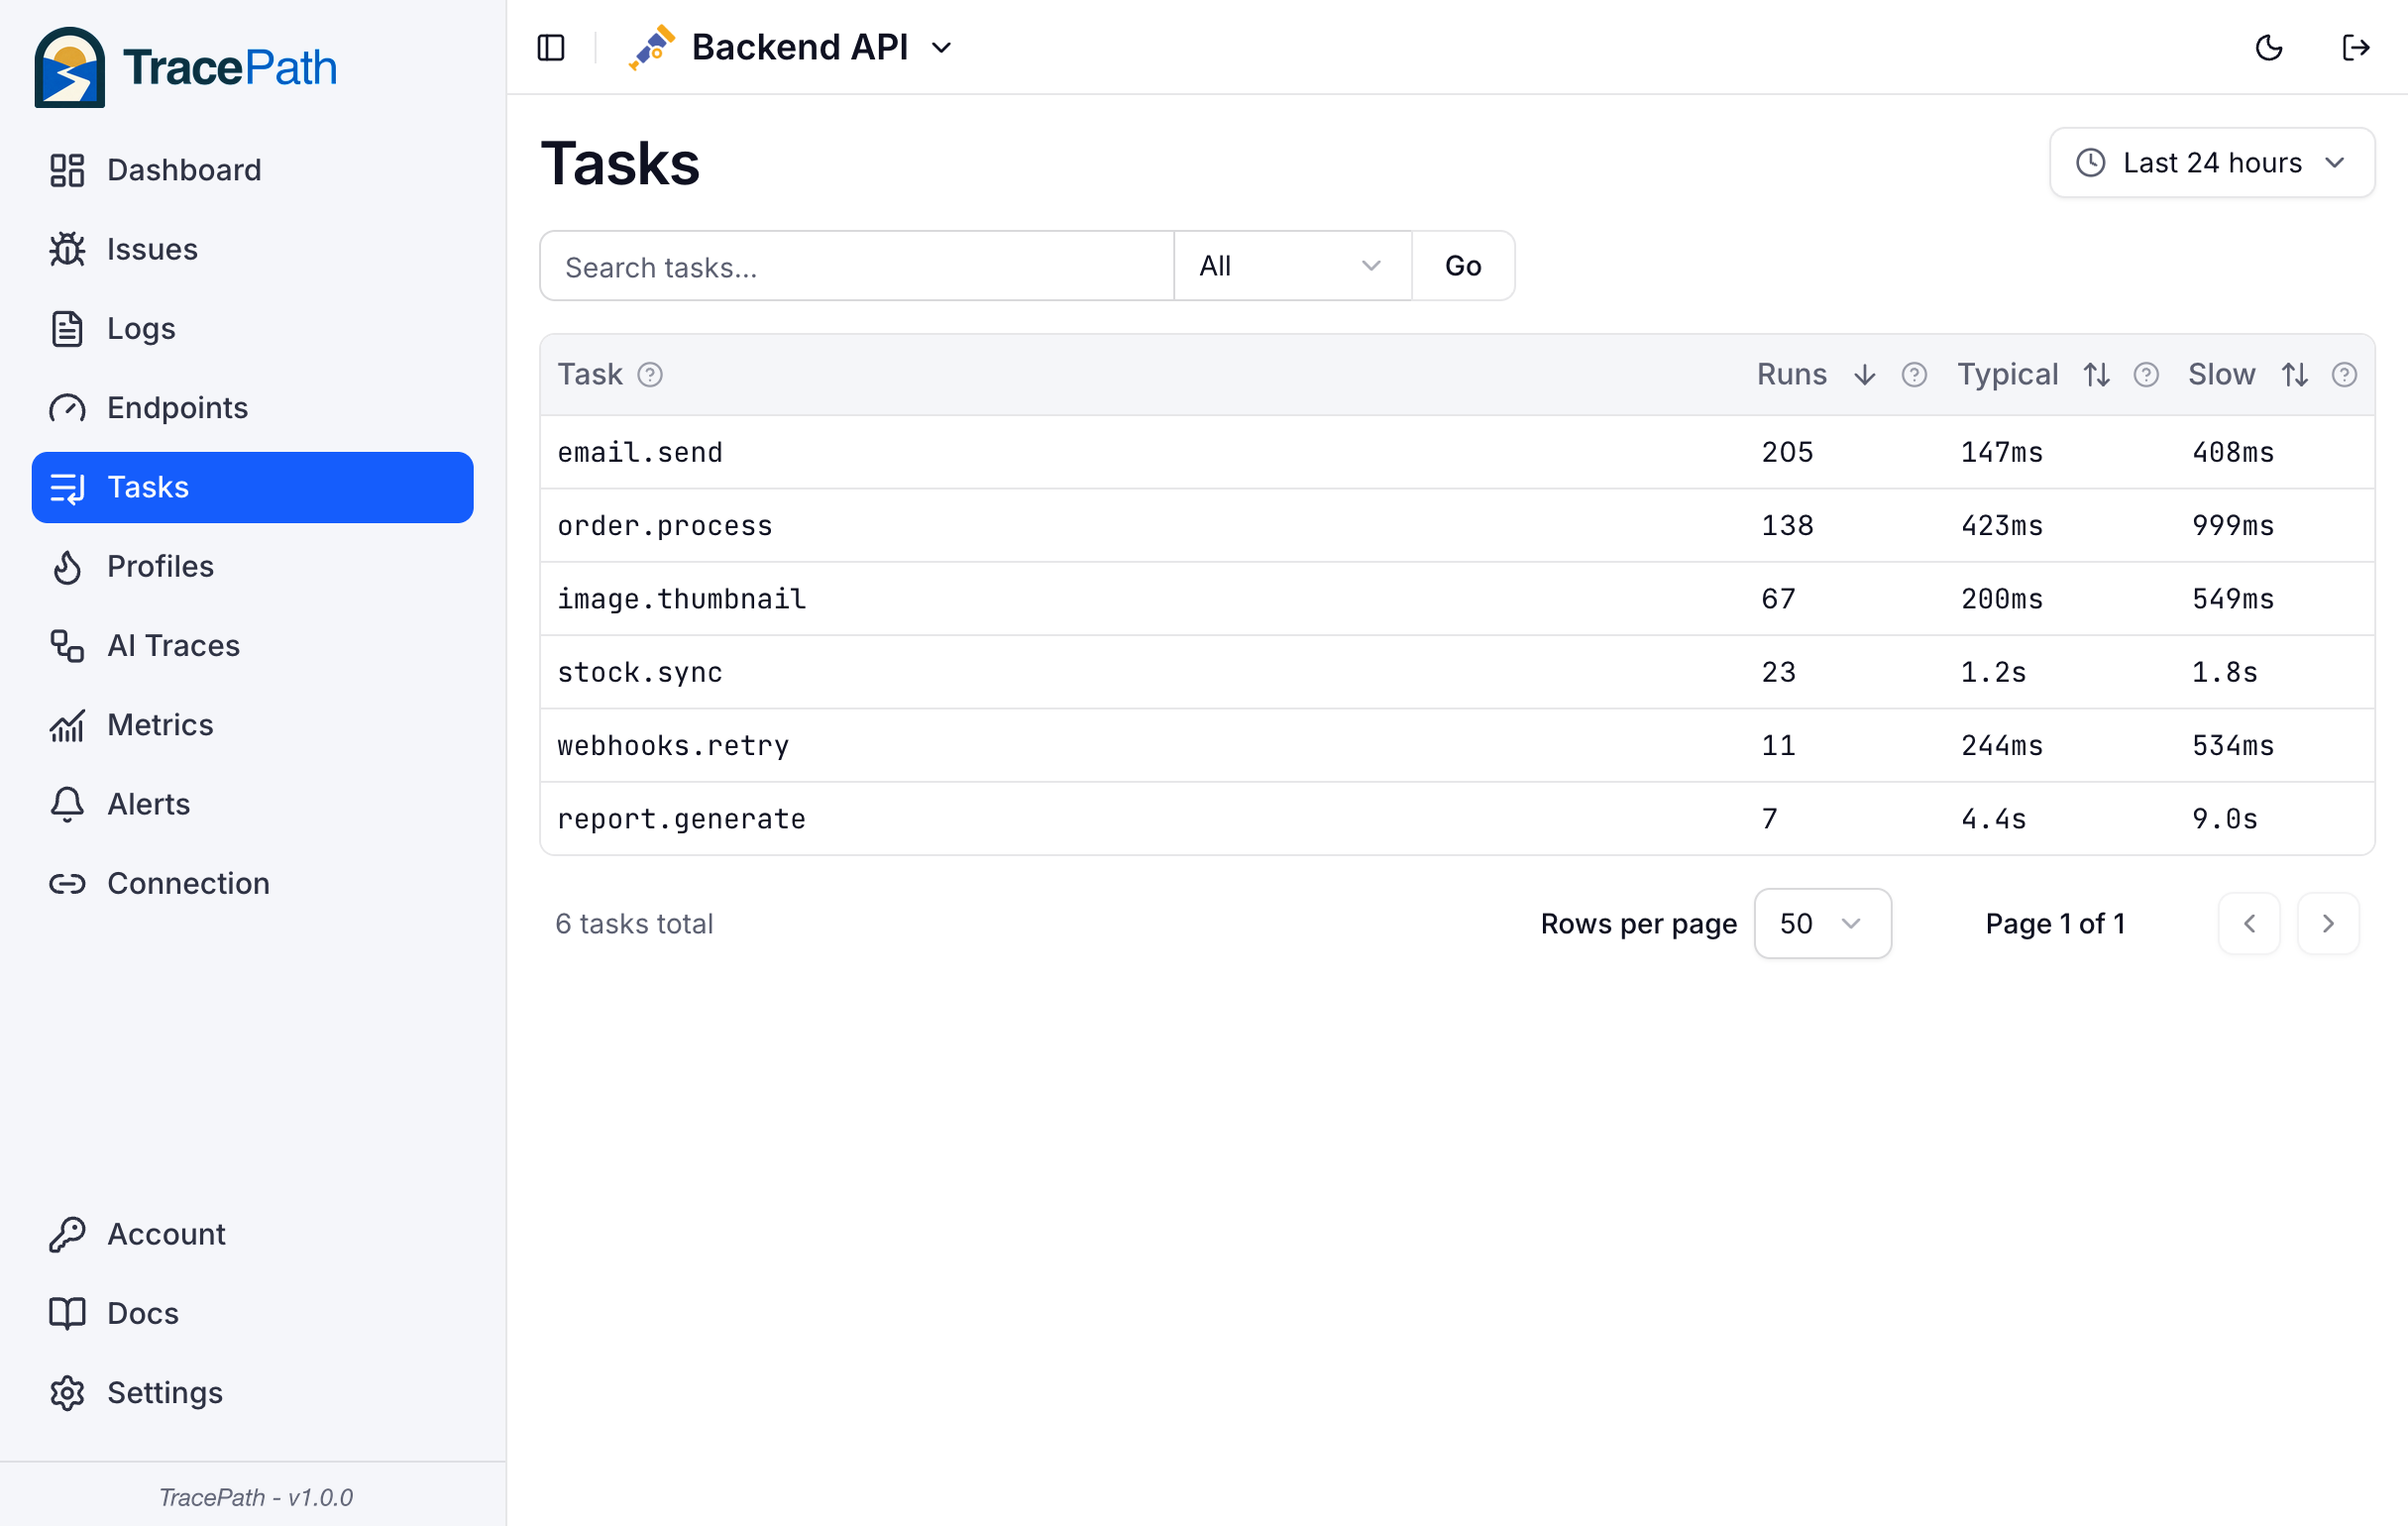
Identified by a task name (job class, scheduled command, agent operation). Ranked by count × (P95 − P50) as a rough impact proxy. CONSUMER spans from any queue driver (database, Redis, SQS, Beanstalk, …) land here, as do root console.command spans.
AI Traces
Identified by trace.name (your agent or workflow). Carries model, provider, input/output/cached/reasoning tokens, input/output/total cost, finish reason, and a pointer to the full conversation in object storage. Ranked by total cost by default.
Lifecycle and sampling
- A span is created in your app (by a framework's auto-instrumentation or by manual OTel calls).
- Child spans, attributes, and events accumulate against it.
- The trace is exported via OTLP.
- TracePath classifies each span, inserts into the matching entity table, and re-roots the remaining children into
spansunder their nearest enclosing entity. - Exceptions recorded as
"exception"events become Issues attributed to the owning entity.
Sampling
Sampling is decided in your application, not in TracePath. There is no server-side sample rate to set: whatever reaches the ingest endpoint is stored, and what does not reach it never existed as far as the dashboard is concerned. That is a deliberate consequence of speaking plain OTLP — the OpenTelemetry sampler you already configure is the only one in the path.
The two knobs worth knowing:
OTEL_TRACES_SAMPLER/OTEL_TRACES_SAMPLER_ARG, the standard environment variables every OTel SDK reads.parentbased_traceidratiowith an arg of0.1keeps a tenth of traces and, because it is parent-based, keeps whole traces rather than fragments of many.- A tail sampler in a collector, if you want to keep every failing trace while thinning the successful ones. The upstream
tailsamplingprocessordoes this: run it in the gateway and give it a policy on status code or latency.
Start at 100% and only sample down when the ingest allowance says you need to. Sampling applies to traces; it does not thin logs or metrics, which have their own volume controls.