Issues
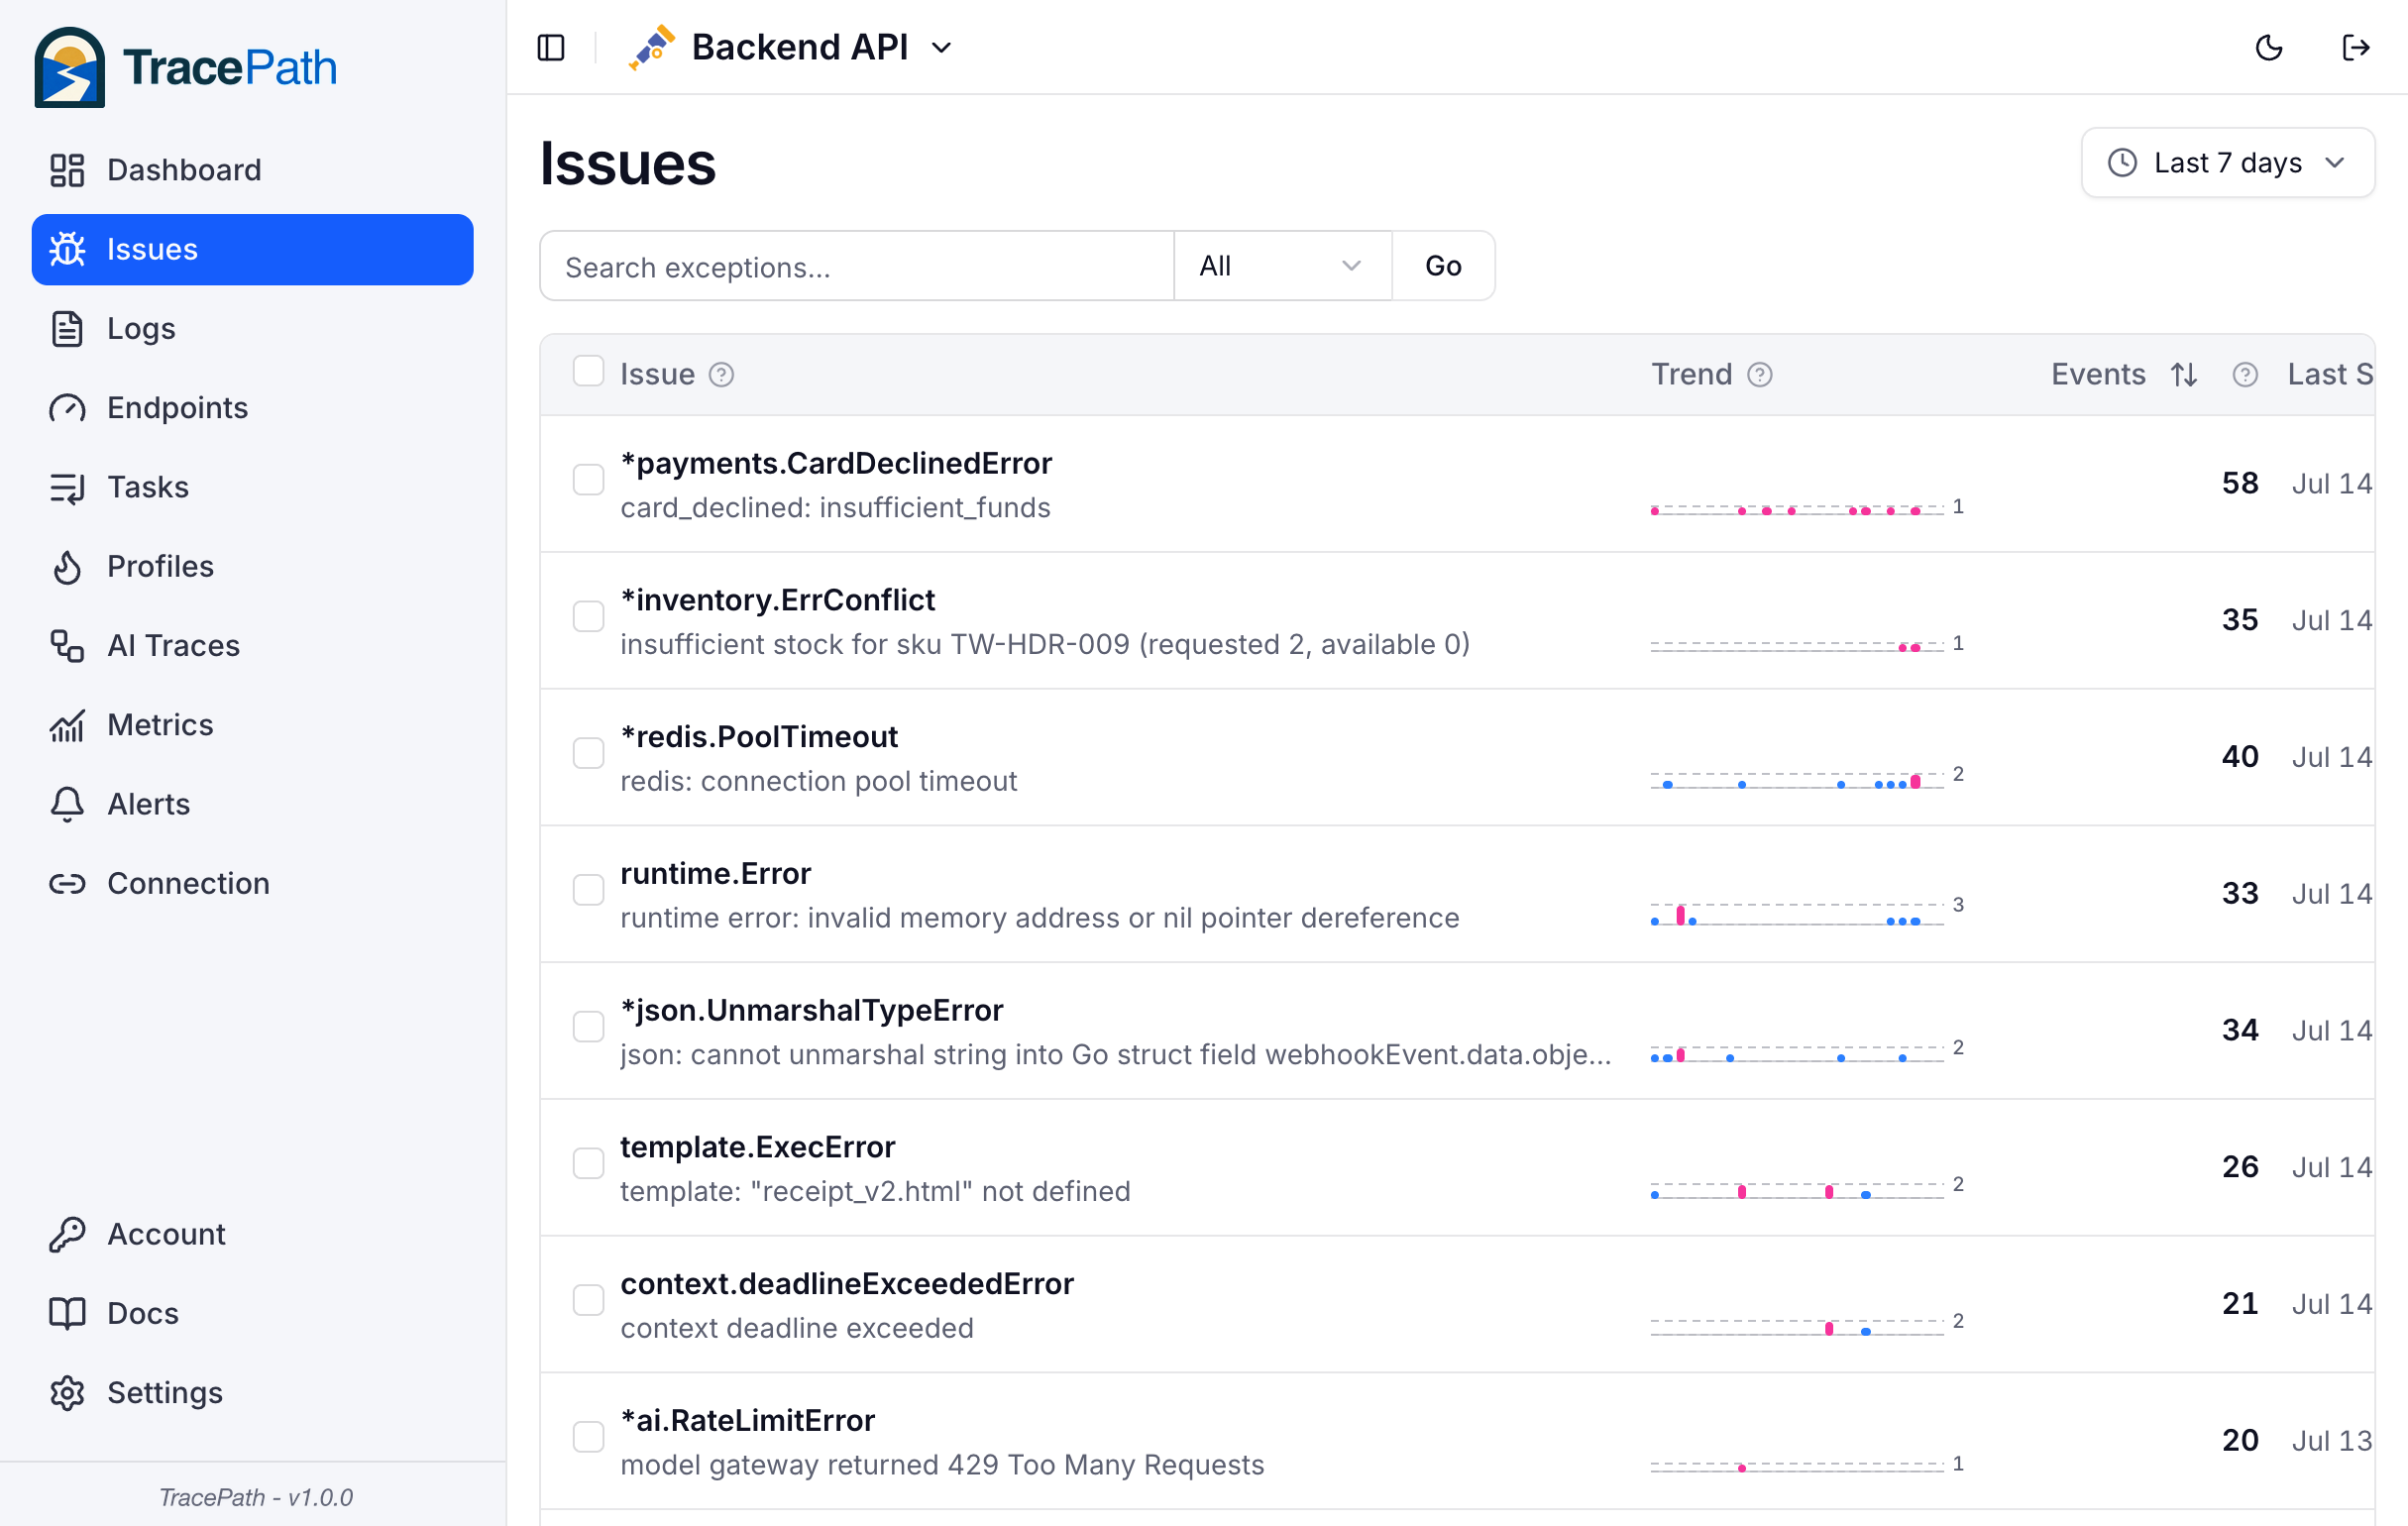
Issues are the failures in your application, grouped so that one bug reads as one row however many times it fired.
What Creates an Issue
Every issue comes from an exception event on a span. There is no separate error endpoint and nothing extra to call: TracePath lifts the event off whichever span carried it and attributes the issue to the entity that span belongs to.
An issue is created when:
- A panic or unhandled exception ends a traced request or task and the instrumentation records it as an exception event on the span. Most OpenTelemetry auto-instrumentation does this for you.
- Your code records one explicitly, with OpenTelemetry's
span.recordException(err)(orrecord_exception,recordException,->recordException()— every OTel SDK has it).
The event's exception.type, exception.message and exception.stacktrace attributes are what TracePath reads. A stack trace is not required: an event with only a type and a message still becomes an issue, it just has no frames to show.
Issues Without a Stack Trace
Recording an exception event with no exception.stacktrace is how you log a named condition that is not a thrown error — a payment provider that answered 503, a webhook that arrived unsigned — and still get grouping, counting and alerting on it.
from opentelemetry import trace

span = trace.get_current_span()
span.add_event(
    "exception",
    {
        "exception.type": "PaymentProviderUnreachable",
        "exception.message": f"provider timed out for order {order_id}",
    },
)
span.set_attribute("order.id", str(order_id))
The grouping rule below drops the message text and keeps the type, so every occurrence of PaymentProviderUnreachable folds into one issue whatever order id it names. Put the variable part in a span attribute, as above, and it stays searchable on each occurrence without splitting the group.
One caveat: the type is only recognised when it is made of letters, digits, dots and underscores. A PHP-style class name written with backslashes (App\Exception\Foo) is not matched, so its message stays in the hash and every distinct message becomes its own issue. Use the dotted or bare form there.
Connection to Traces
Issues can be linked to a trace via context. When an exception occurs during an HTTP request or background task, the trace ID is automatically attached to the issue.
This linkage means:
- Viewing an issue shows which endpoint or task triggered it
- Viewing a trace shows any issues that occurred during execution
- Attributes from the trace context are included in the issue
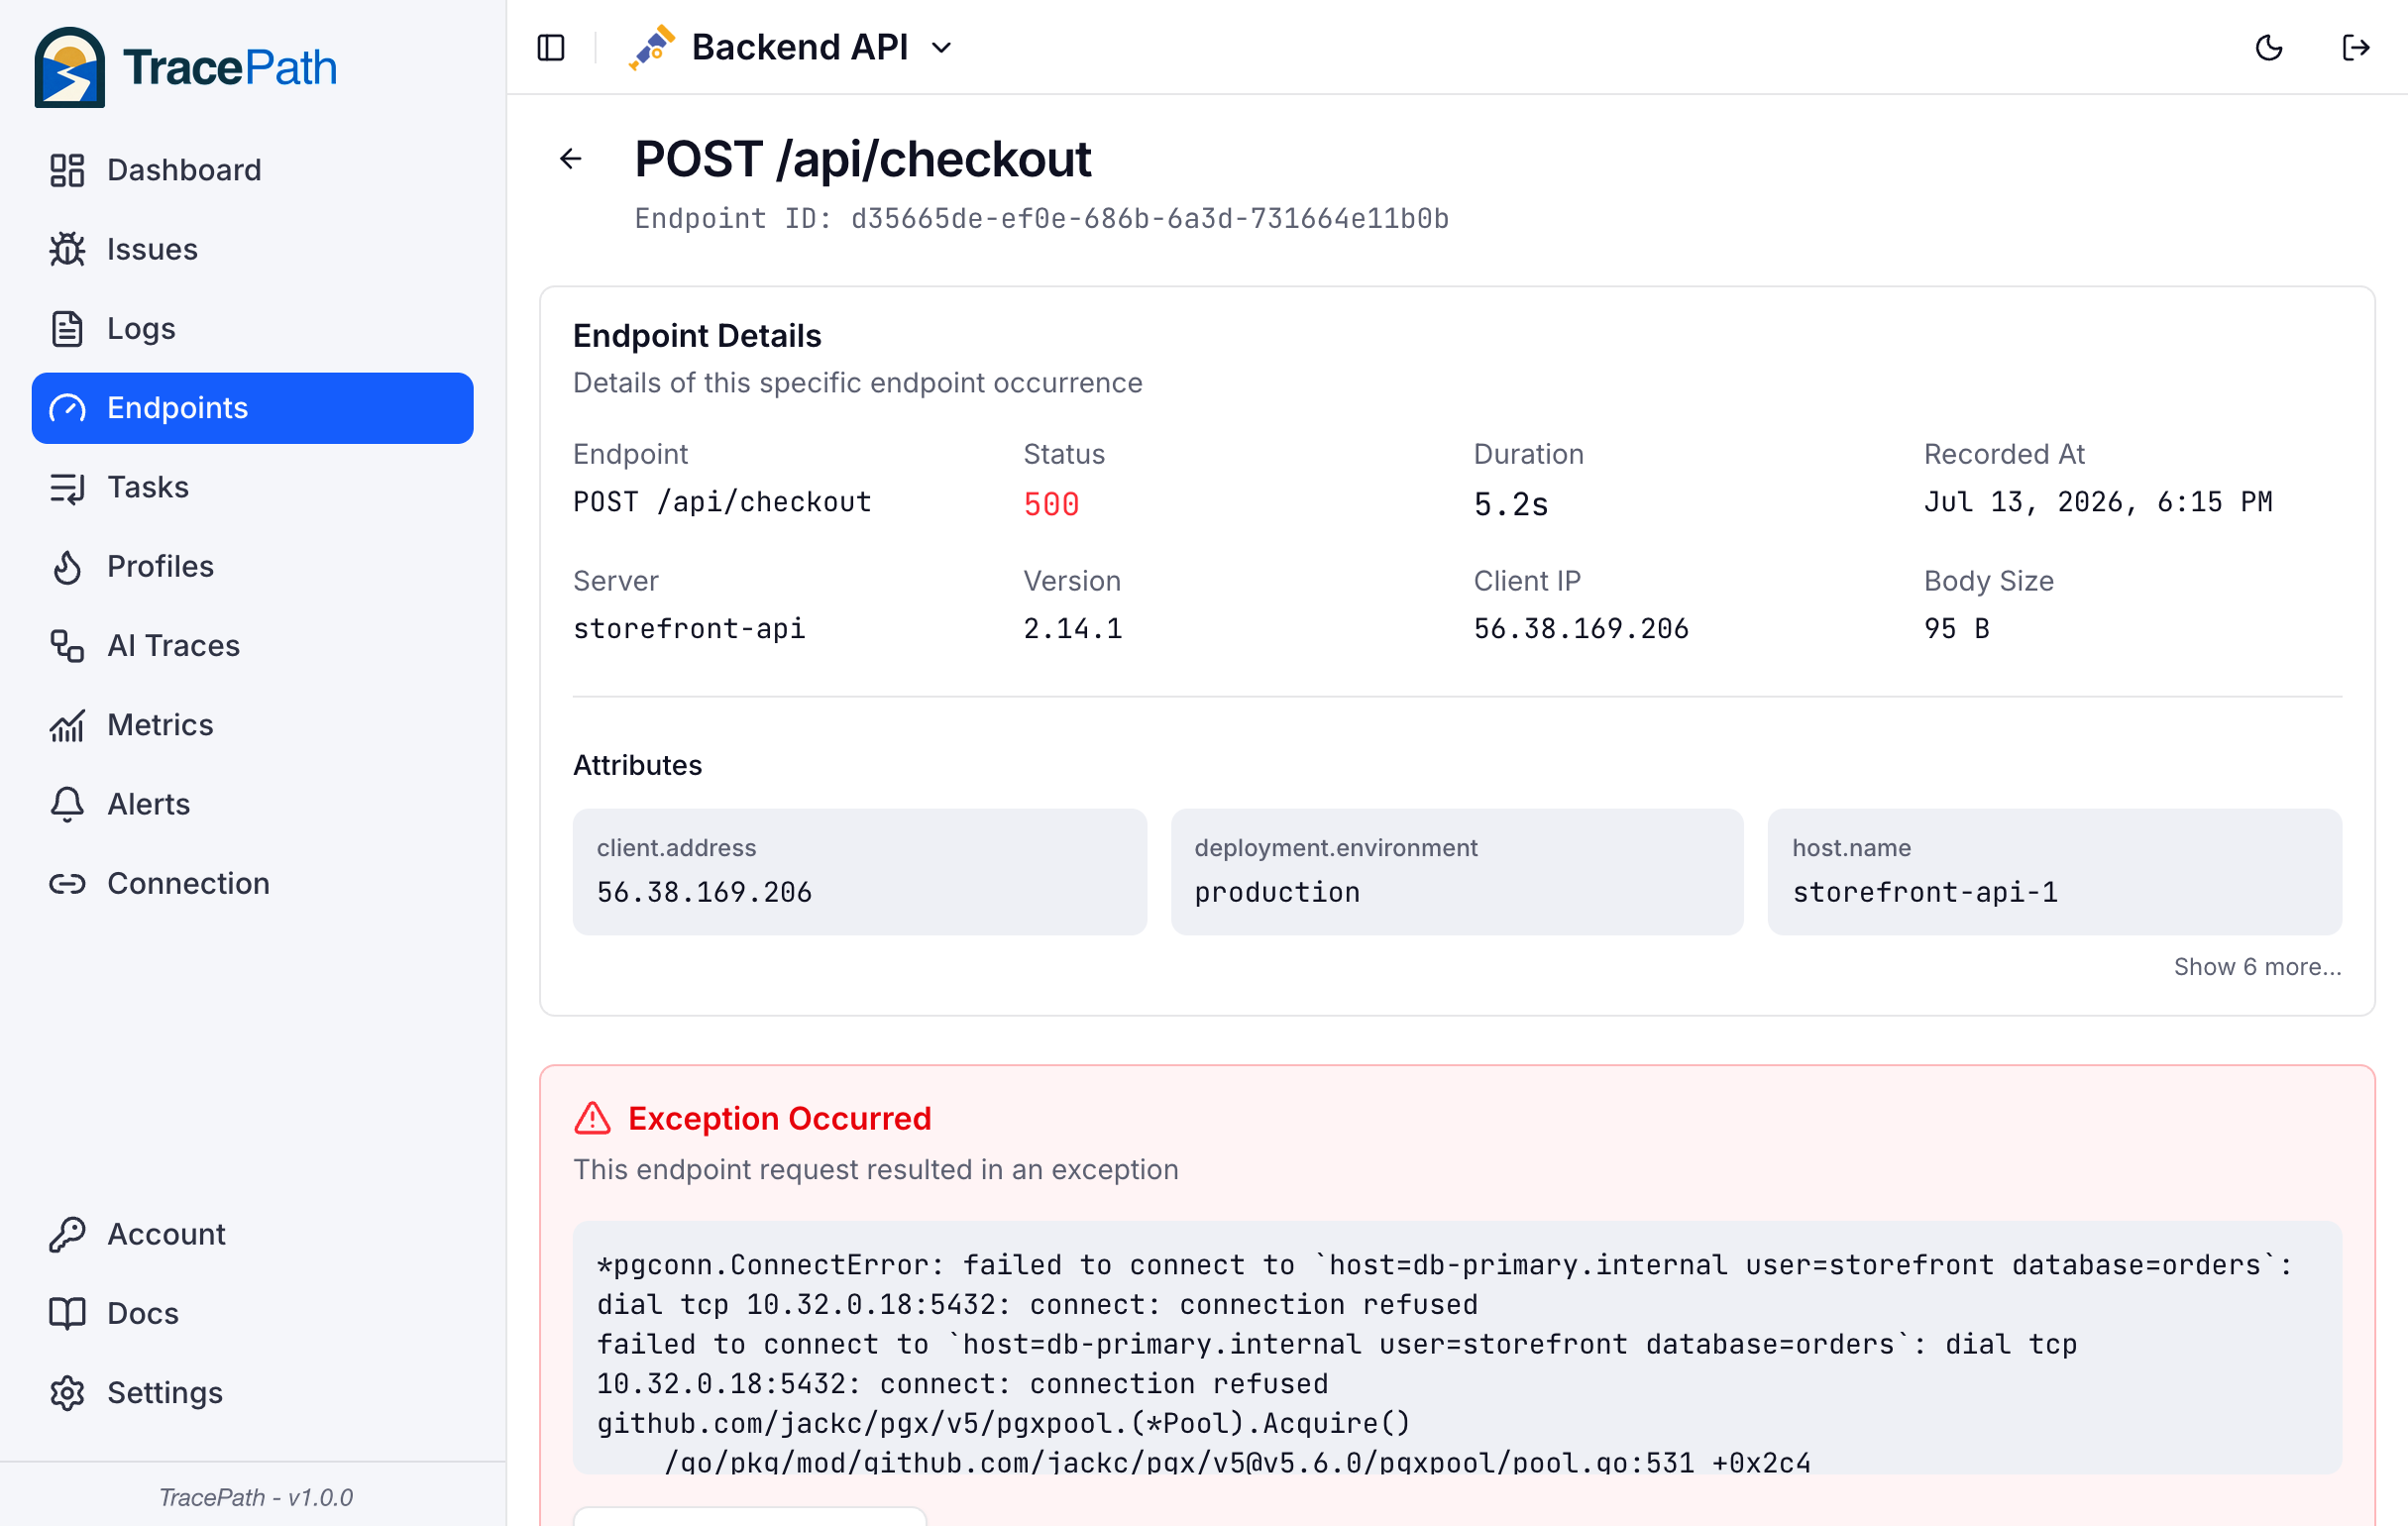
Issues captured outside of a trace context (no active request or task) are recorded as standalone issues without a trace link.
Fingerprinting
Every error is assigned a fingerprint: a 16-character hash of its normalized stack trace. The fingerprint is the identity of an issue. All occurrences that share it fold into a single issue, the issue URL contains it (/issues/<hash>), and archiving, regression detection, and alerting all key on it.
Why Group Errors
Without grouping, one bug in a hot path produces thousands of raw exceptions that differ only in runtime data: another user ID, another memory address, another server. Grouping reduces that stream to one issue with an occurrence count, which keeps two things useful:
- The issues list stays readable. One row per root cause instead of pages of near-duplicates, so the list ranks real problems rather than repetitions of the same one.
- Alerts stay consistent. A New Issue rule fires once per group, not once per occurrence, and Error Regression can tell that a previously resolved error has genuinely returned. If grouping were unstable, every alert rule would either flood you or stay silent.
How the Hash Is Computed
Before hashing, TracePath normalizes the stack trace so values that vary between occurrences of the same bug never affect the hash:
| Normalization | Effect |
|---|---|
| Error message | Only the error type is kept (TimeoutError, *net.OpError). The message text, which often embeds user data, is dropped, including the messages on JVM Caused by: lines. The type has to be letters, digits, dots and underscores, so a PHP class written with backslashes (App\Exception\Foo) is not recognised and keeps its message in the hash. |
| Runtime values | Hex addresses, UUIDs, IP addresses and ports, email addresses, goroutine numbers, and long numbers (epoch timestamps, numeric IDs) are replaced with placeholders. |
| File locations | Absolute paths collapse to filename:line, URL origins are stripped from browser frames, and @v1.2.3 module version suffixes are removed so a dependency bump does not split a group. |
| JVM frames | Line numbers inside (File.java:123) are dropped, and ... 12 more becomes ... more. |
| Column numbers | Dropped from frames that end in :line:col, unless the line number is 1. Minified bundles put everything on line 1, and the column is the only thing distinguishing frames there. Frames that carry the position inside brackets, such as Dart (main.dart:20:3), keep the column. |
| Resolved function names | JavaScript function-name lines are collapsed to <fn>, so better JS name resolution alone does not re-bucket an issue. Function and method names in other formats, such as Dart, iOS and JVM frames, are part of the hash. Uploading debug info for the first time also rewrites each frame's file, line and column, so occurrences from before the upload keep their old hash and later ones form a new issue. |
| Whitespace | Runs of spaces and blank lines are collapsed. |
The normalized trace is hashed with SHA-256 and truncated to 16 characters.
What Stays Together, What Splits
The same logical error keeps the same hash across servers, environments, app versions, and users. A new hash (and therefore a new issue and a New Issue alert) appears when the failure itself changes: a different error type, or a different code path with different frames. Line numbers are part of the hash for most languages, so a refactor that moves code within a file can legitimately re-group an error after a deploy. JVM frames are the exception. Their line numbers are removed, so moving Java, Kotlin or Scala code inside a file keeps the same issue.
Choosing an Exception Type
Because the message is dropped and the type is kept, the type is the thing you are naming a group with. It is worth choosing deliberately in the cases where you control it:
- Raise a distinct type per condition you would want to alert on separately.
PaymentProviderUnreachableandPaymentDeclinedshould not share a type just because they both come from the payment client. - Do not encode variable data in the type. A type built from an order id or a tenant name makes one issue per order, which defeats grouping and floods New Issue alerts.
- Leave the detail in the message and in span attributes. Both are kept on every occurrence and are searchable; neither affects which group the occurrence lands in.
The Issues / Messages filter
The search bar on the Issues page carries an All / Issues / Messages selector. "Messages" is a second issue kind, stored alongside errors and grouped by exact text rather than by a normalized stack trace. Nothing on the OTLP ingest path produces one — every issue that arrives over OpenTelemetry is an error — so on a TracePath Cloud project the Messages filter returns nothing and All is the setting to leave it on.
Issue Lifecycle
- Active: When an issue first occurs
- Archived: Marked as resolved by you (hidden from the default view)
- Reopened: An archived issue that occurred again (regression detected)
Attributes on Issues
An issue occurrence carries the attributes of the span the exception event fired on, captured at ingest. So whatever the request handler had already set is on the issue: the HTTP semantic-convention attributes your instrumentation adds (http.request.method, http.route, http.response.status_code, url.path, server.address) plus anything you set yourself.
That last part is the one line of code worth adding. Set the identity you would search by — the user, the tenant, the order — on the active span as early as the request knows it, and every exception that fires later in that request is searchable by it:
import { trace } from '@opentelemetry/api';

trace.getActiveSpan()?.setAttributes({
  'user.id': user.id,
  'tenant.id': user.tenantId,
});
Two things are not collected for you, by design:
- Request bodies and headers. Nothing reads them, so nothing can leak them. If you want a field from the body on the issue, set it as a span attribute yourself, and leave out anything you would not want a teammate with project access to read.
- Query strings beyond what your instrumentation records. Most OTel HTTP instrumentation puts the path in
url.pathand the query inurl.query, and some redacts the query by default. Check your instrumentation's configuration if a query parameter you expect is missing — or, better, set the value you care about as an attribute explicitly.
See Attributes for the broader model, and Sessions for the browser side.