Data Flow
This page follows one request from your application to the dashboard, so the concepts in the rest of this section have somewhere to hang.
Endpoint flow
How the pieces connect in a typical HTTP request:
- Request arrives → your OpenTelemetry instrumentation starts a
SERVERspan. This is what becomes a Trace, and the span itself becomes an Endpoint row. - Auth middleware runs → you set
user_id(or a tenant, a plan, whatever identifies the caller) as a span Attribute. TracePath knows nothing about your authentication; this step is yours. - Handler executes → child Spans record the sub-operations: database queries, outbound HTTP calls, cache lookups, model calls.
- An error is thrown → the exception event on the span becomes an Issue, carrying the attributes that were in scope.
- Request completes → the span closes with a duration and a status code, and the whole trace is exported.
Steps 1, 3 and 5 are automatic with standard OpenTelemetry auto-instrumentation. Step 2 is the one line of code that makes everything else searchable.
Task flow
Background work follows the same shape, with a CONSUMER or INTERNAL root span instead of a SERVER one:
- Task starts → a root span opens for the queue consumer, cron job, or CLI command. It becomes a Task row.
- Task code executes → child spans record the sub-operations, exactly as in a request.
- An error is thrown → captured as an Issue, linked to the task's trace.
- Task completes → duration and outcome are recorded.
A task started by an HTTP request keeps the originating trace id, so the request and the work it queued read as one distributed trace. See Traces.
Metrics flow
- Host metrics are scraped by a collector on the machine — see OTel Agent for a plain server, or Kubernetes for a cluster.
- Application metrics come from your own OpenTelemetry meters: counters, gauges and histograms you define.
- Batched and exported over OTLP/HTTP, on whatever interval you configure. A 30- or 60-second interval is typical.
- Displayed on dashboards: line, area and bar charts, single values, gauges and tables, filterable and groupable by tag.
Metrics are independent of the trace pipeline. A metric point does not need a span, and a span does not produce metrics.
Ingestion
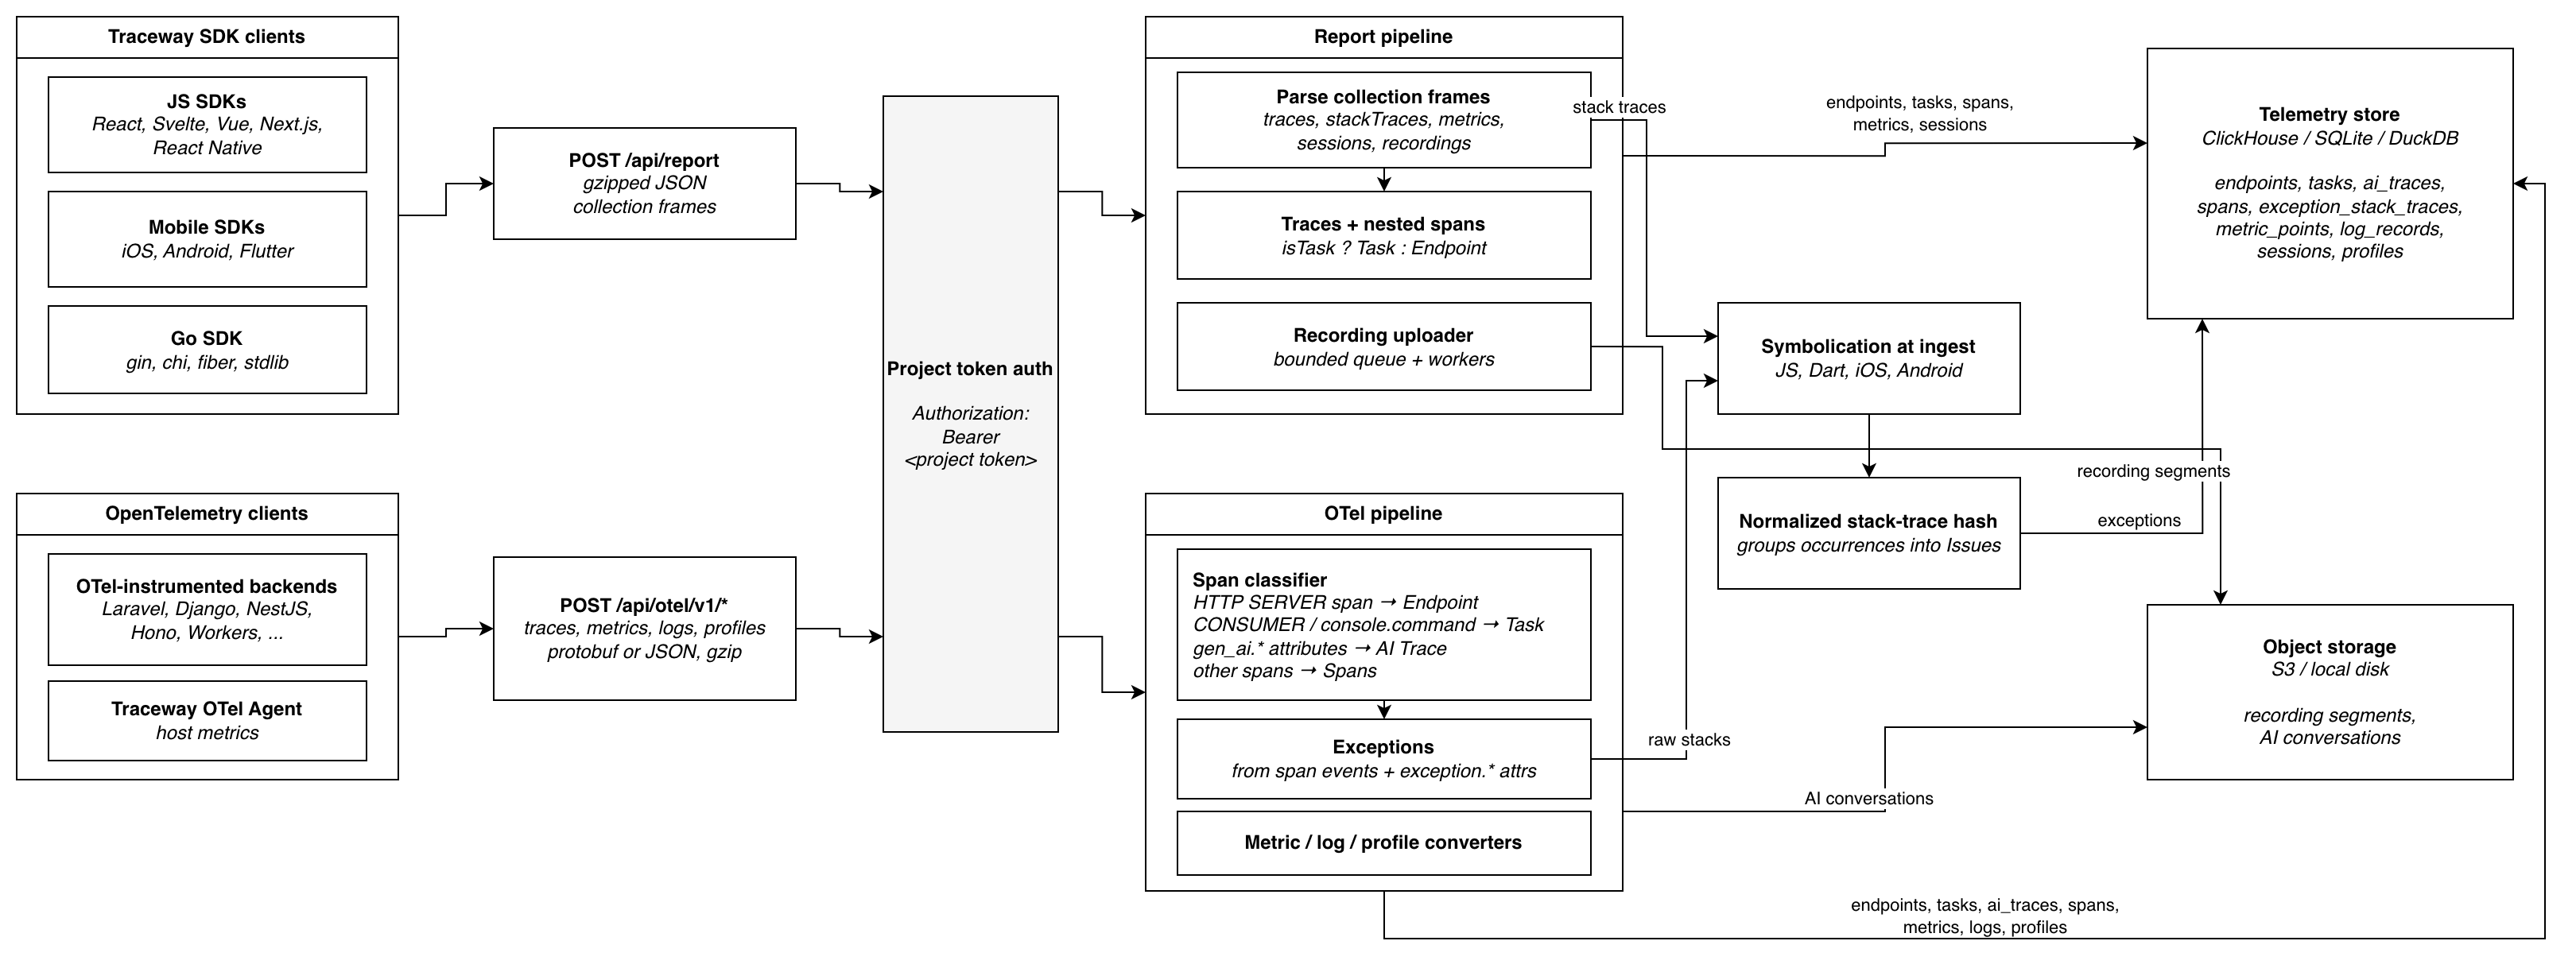
Everything above arrives over OTLP/HTTP at https://ingest.tracepath.dev/api/otel:
| Signal | Path |
|---|---|
| Traces | POST /api/otel/v1/traces |
| Metrics | POST /api/otel/v1/metrics |
| Logs | POST /api/otel/v1/logs |
Every request carries Authorization: Bearer <project token>. The body is OTLP protobuf (Content-Type: application/x-protobuf) or OTLP JSON (application/json), optionally gzipped with Content-Encoding: gzip, up to 10 MB decompressed per request — a larger one answers 413.
At ingest, each span is classified into one of the dashboard's tables (Endpoint, Task, AI Trace) and its exception events are lifted into Issues. Stack traces are symbolicated at this point if a matching source map has been uploaded. The underlying spans remain the source of truth; the tables are projections over them. See the Overview for that model and Traces for the classification rules.
After collection
From the dashboard you can then:
- Sort endpoints by impact to find the worst performers.
- Get alerted when errors spike, and paged when they matter at 3am.
- Track task durations over time.
- Watch host and application health on dashboards.
- Probe from outside with monitors, so you find out about an outage that produced no telemetry at all.